Delmarva Map Series
← Back to
GIS Projects
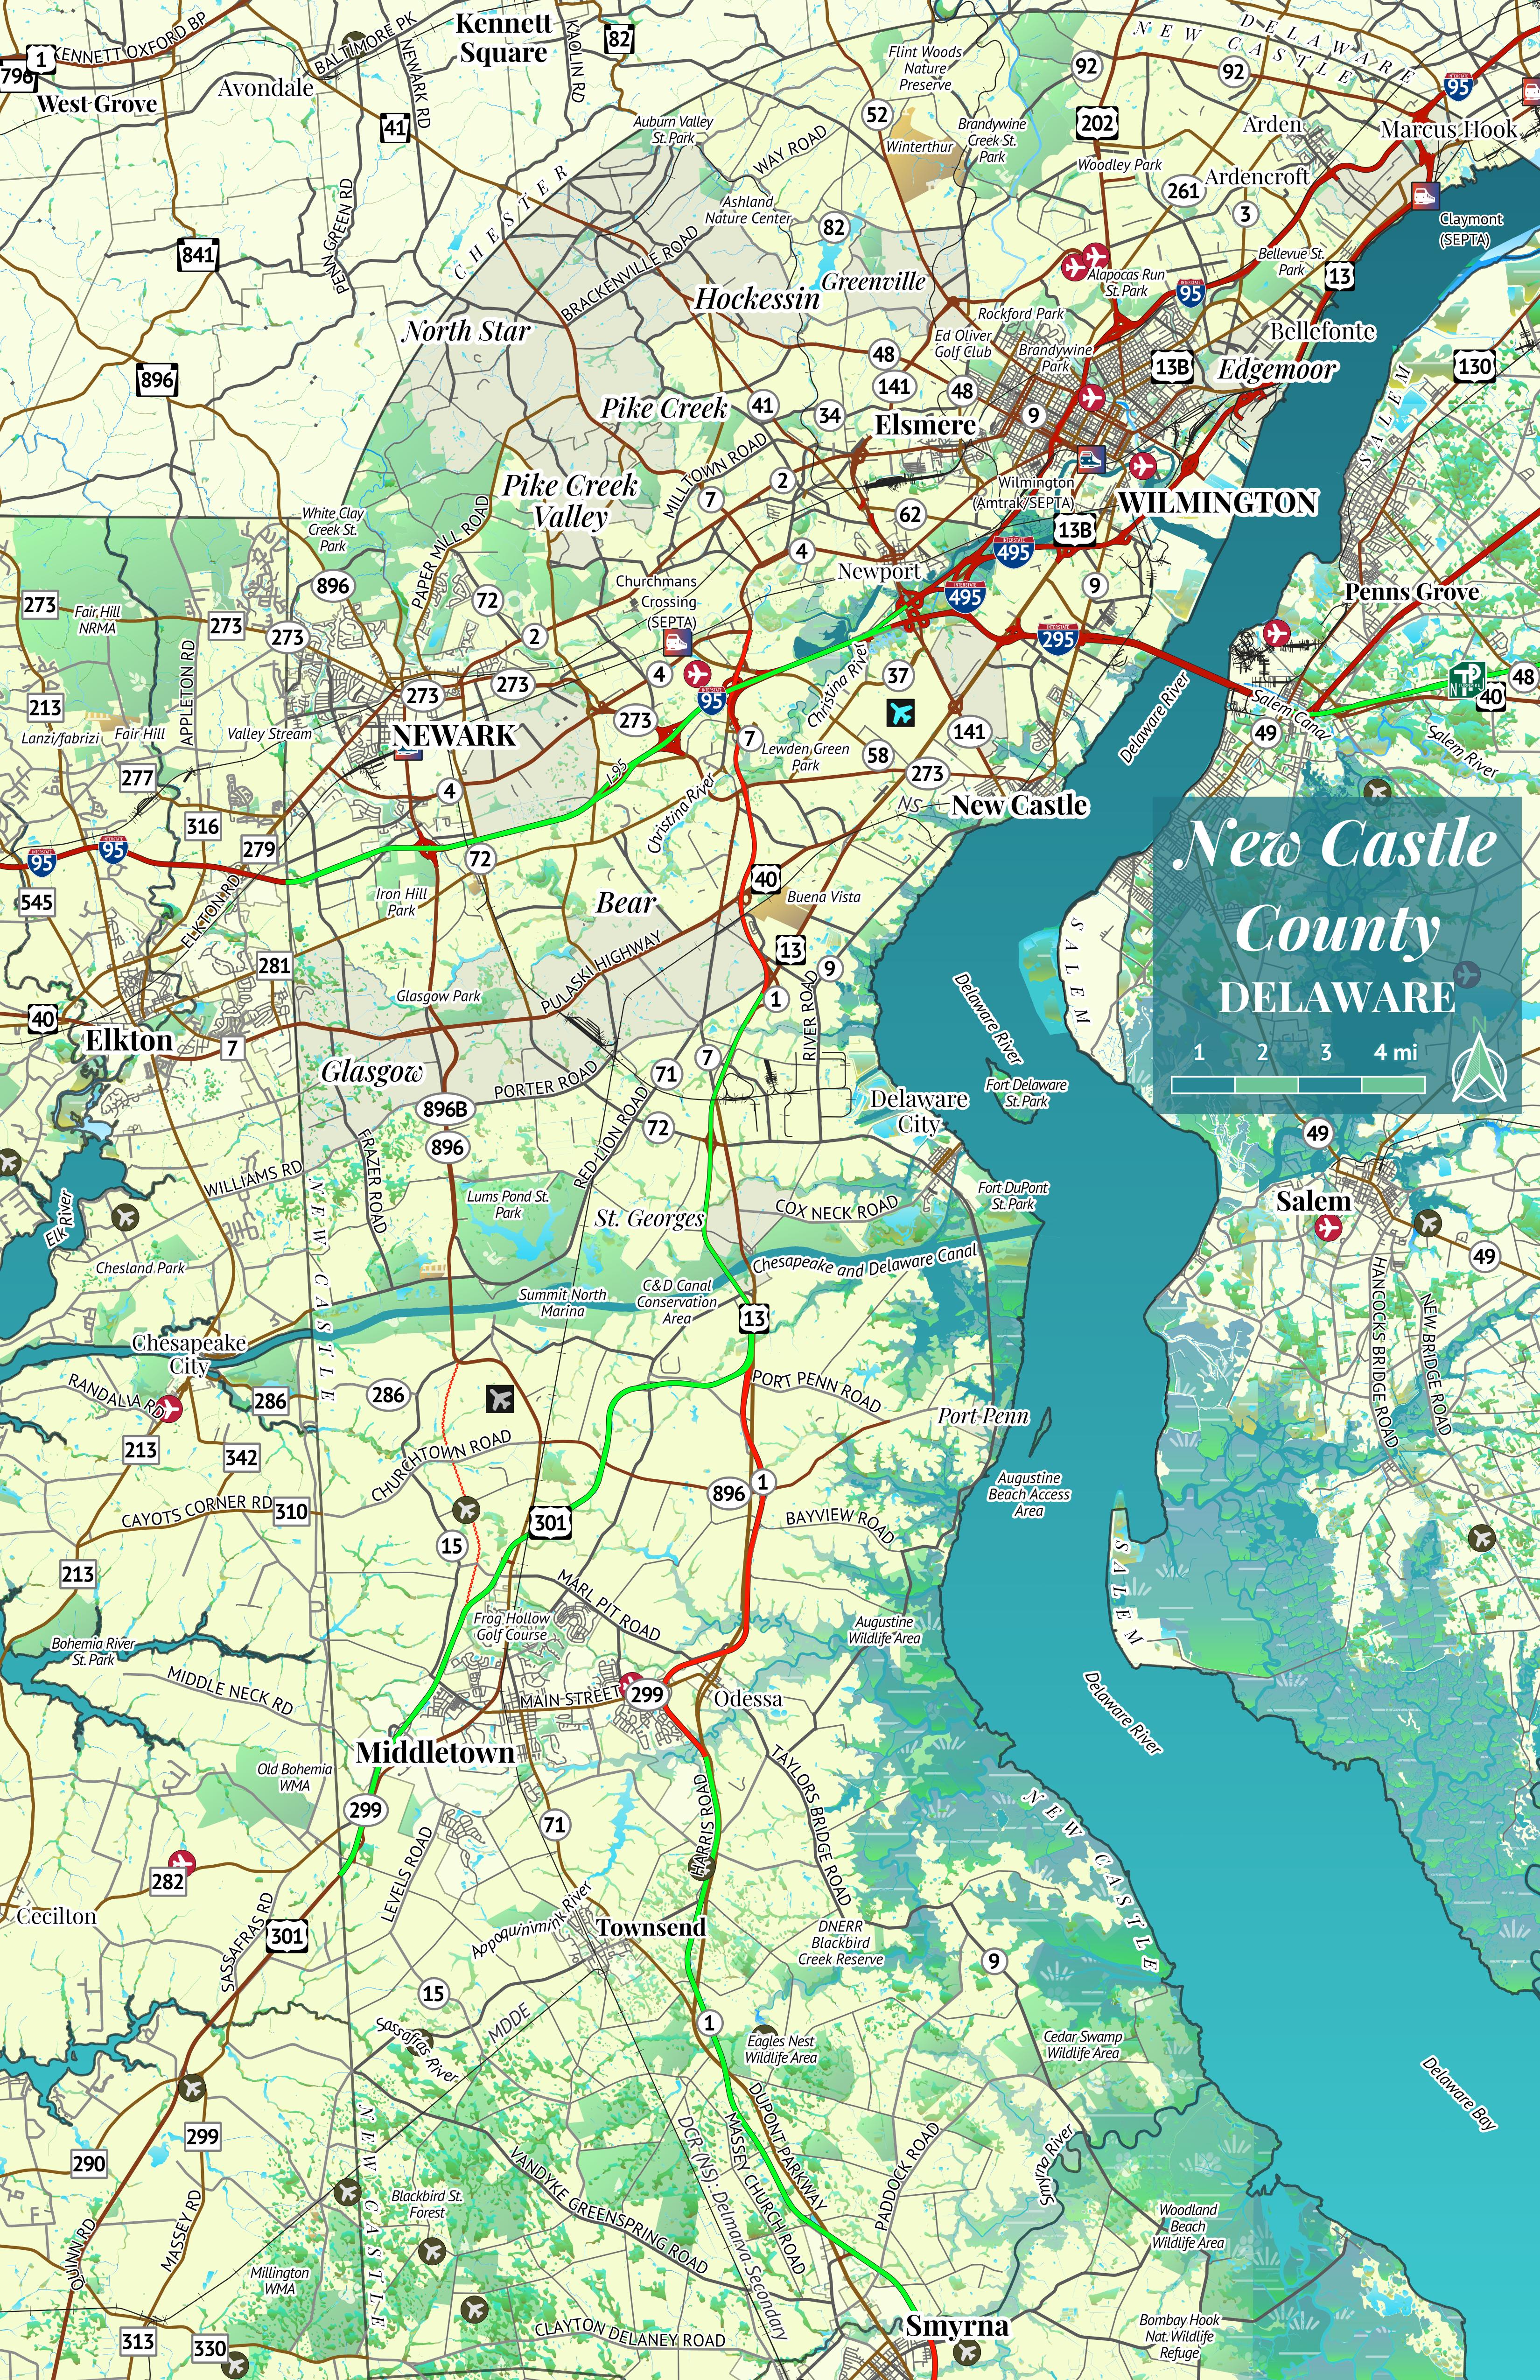
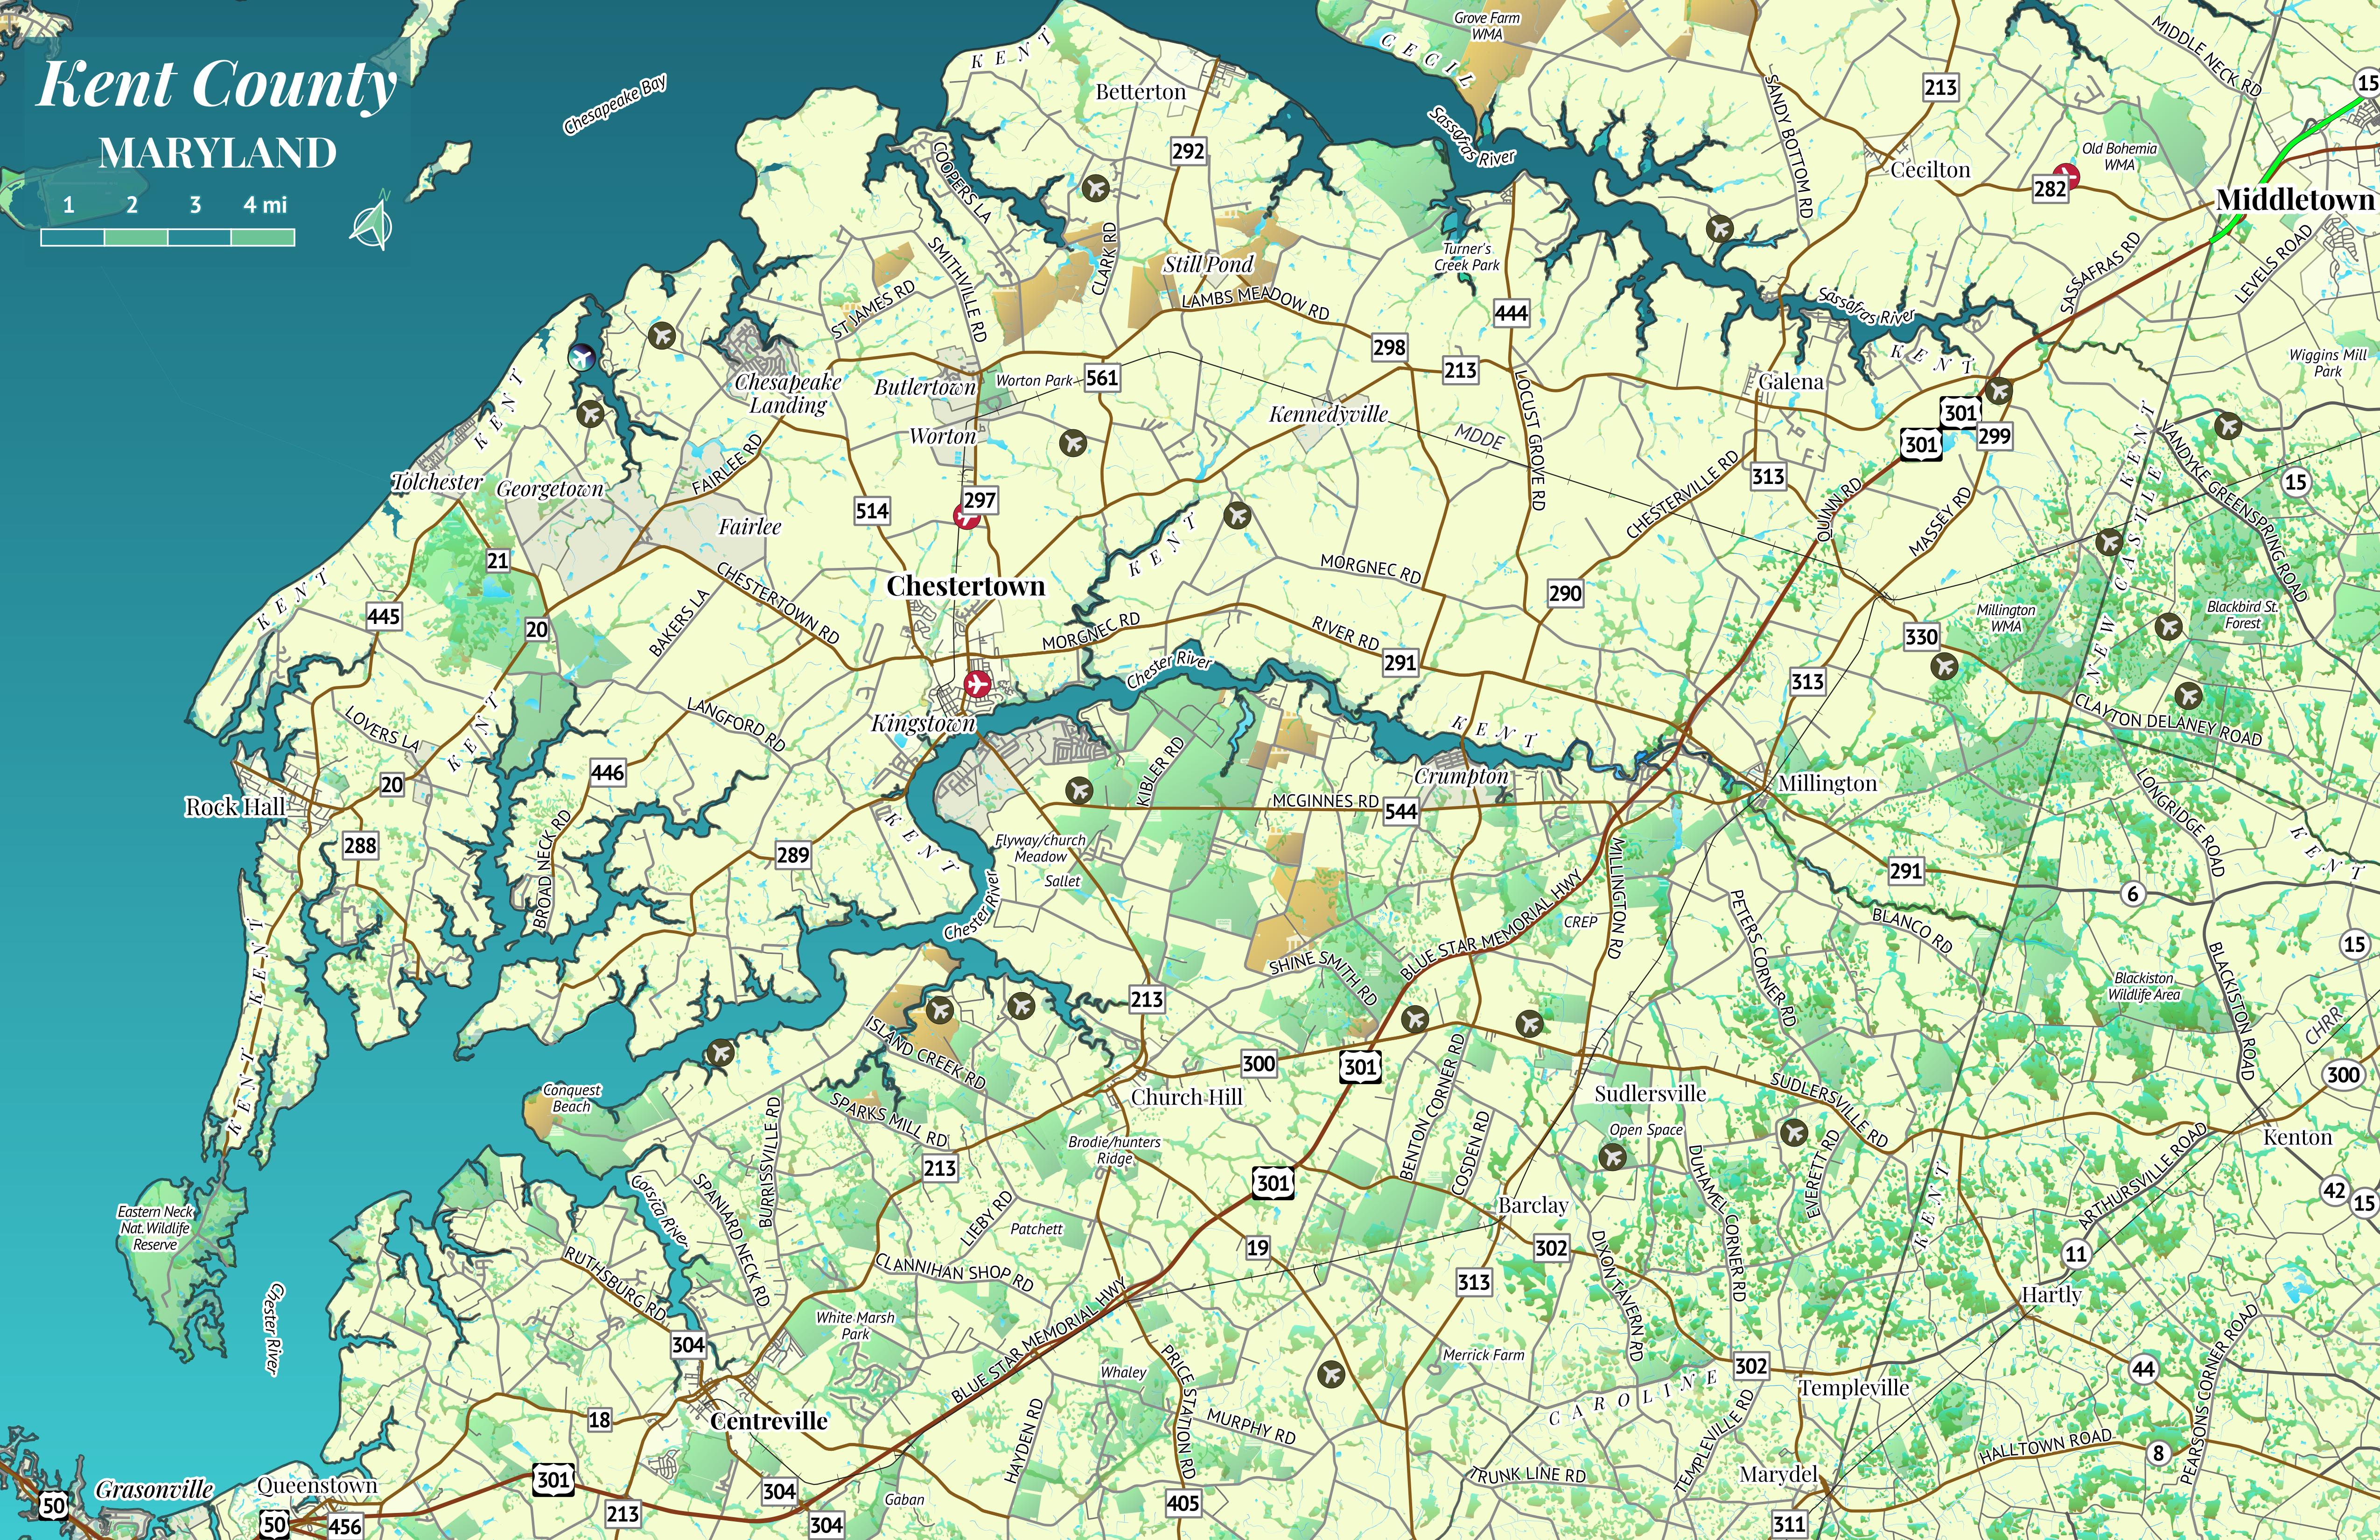
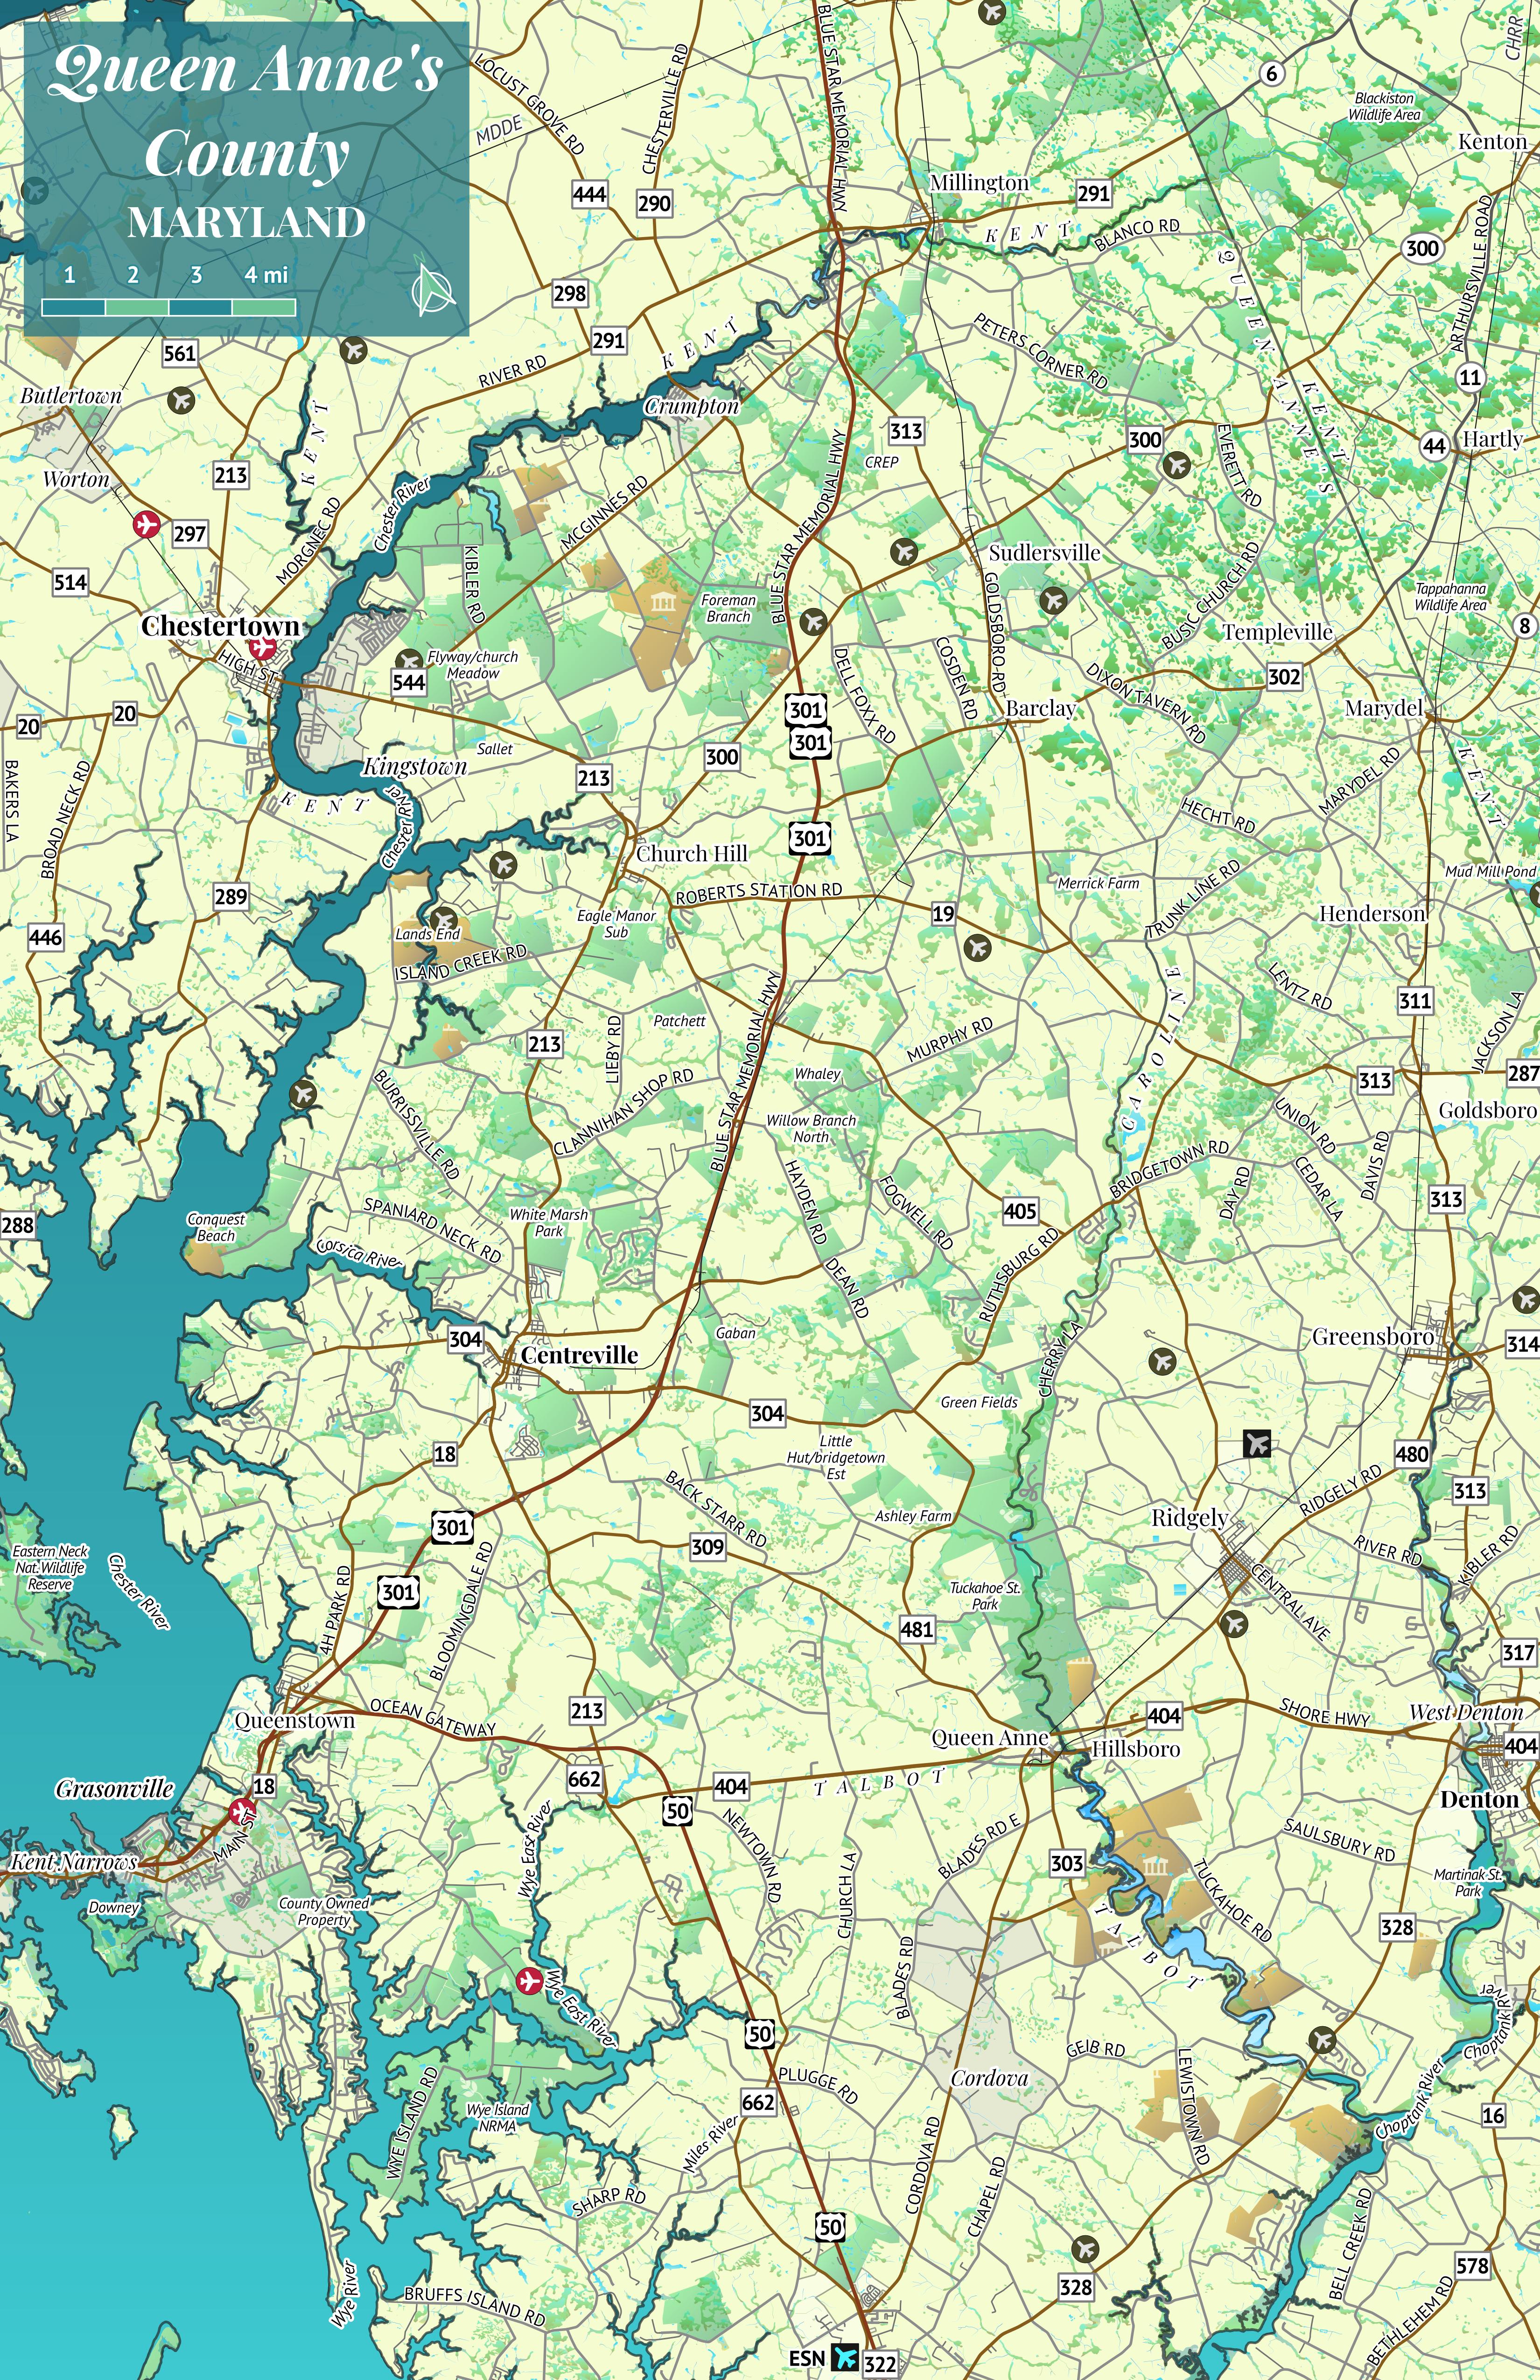
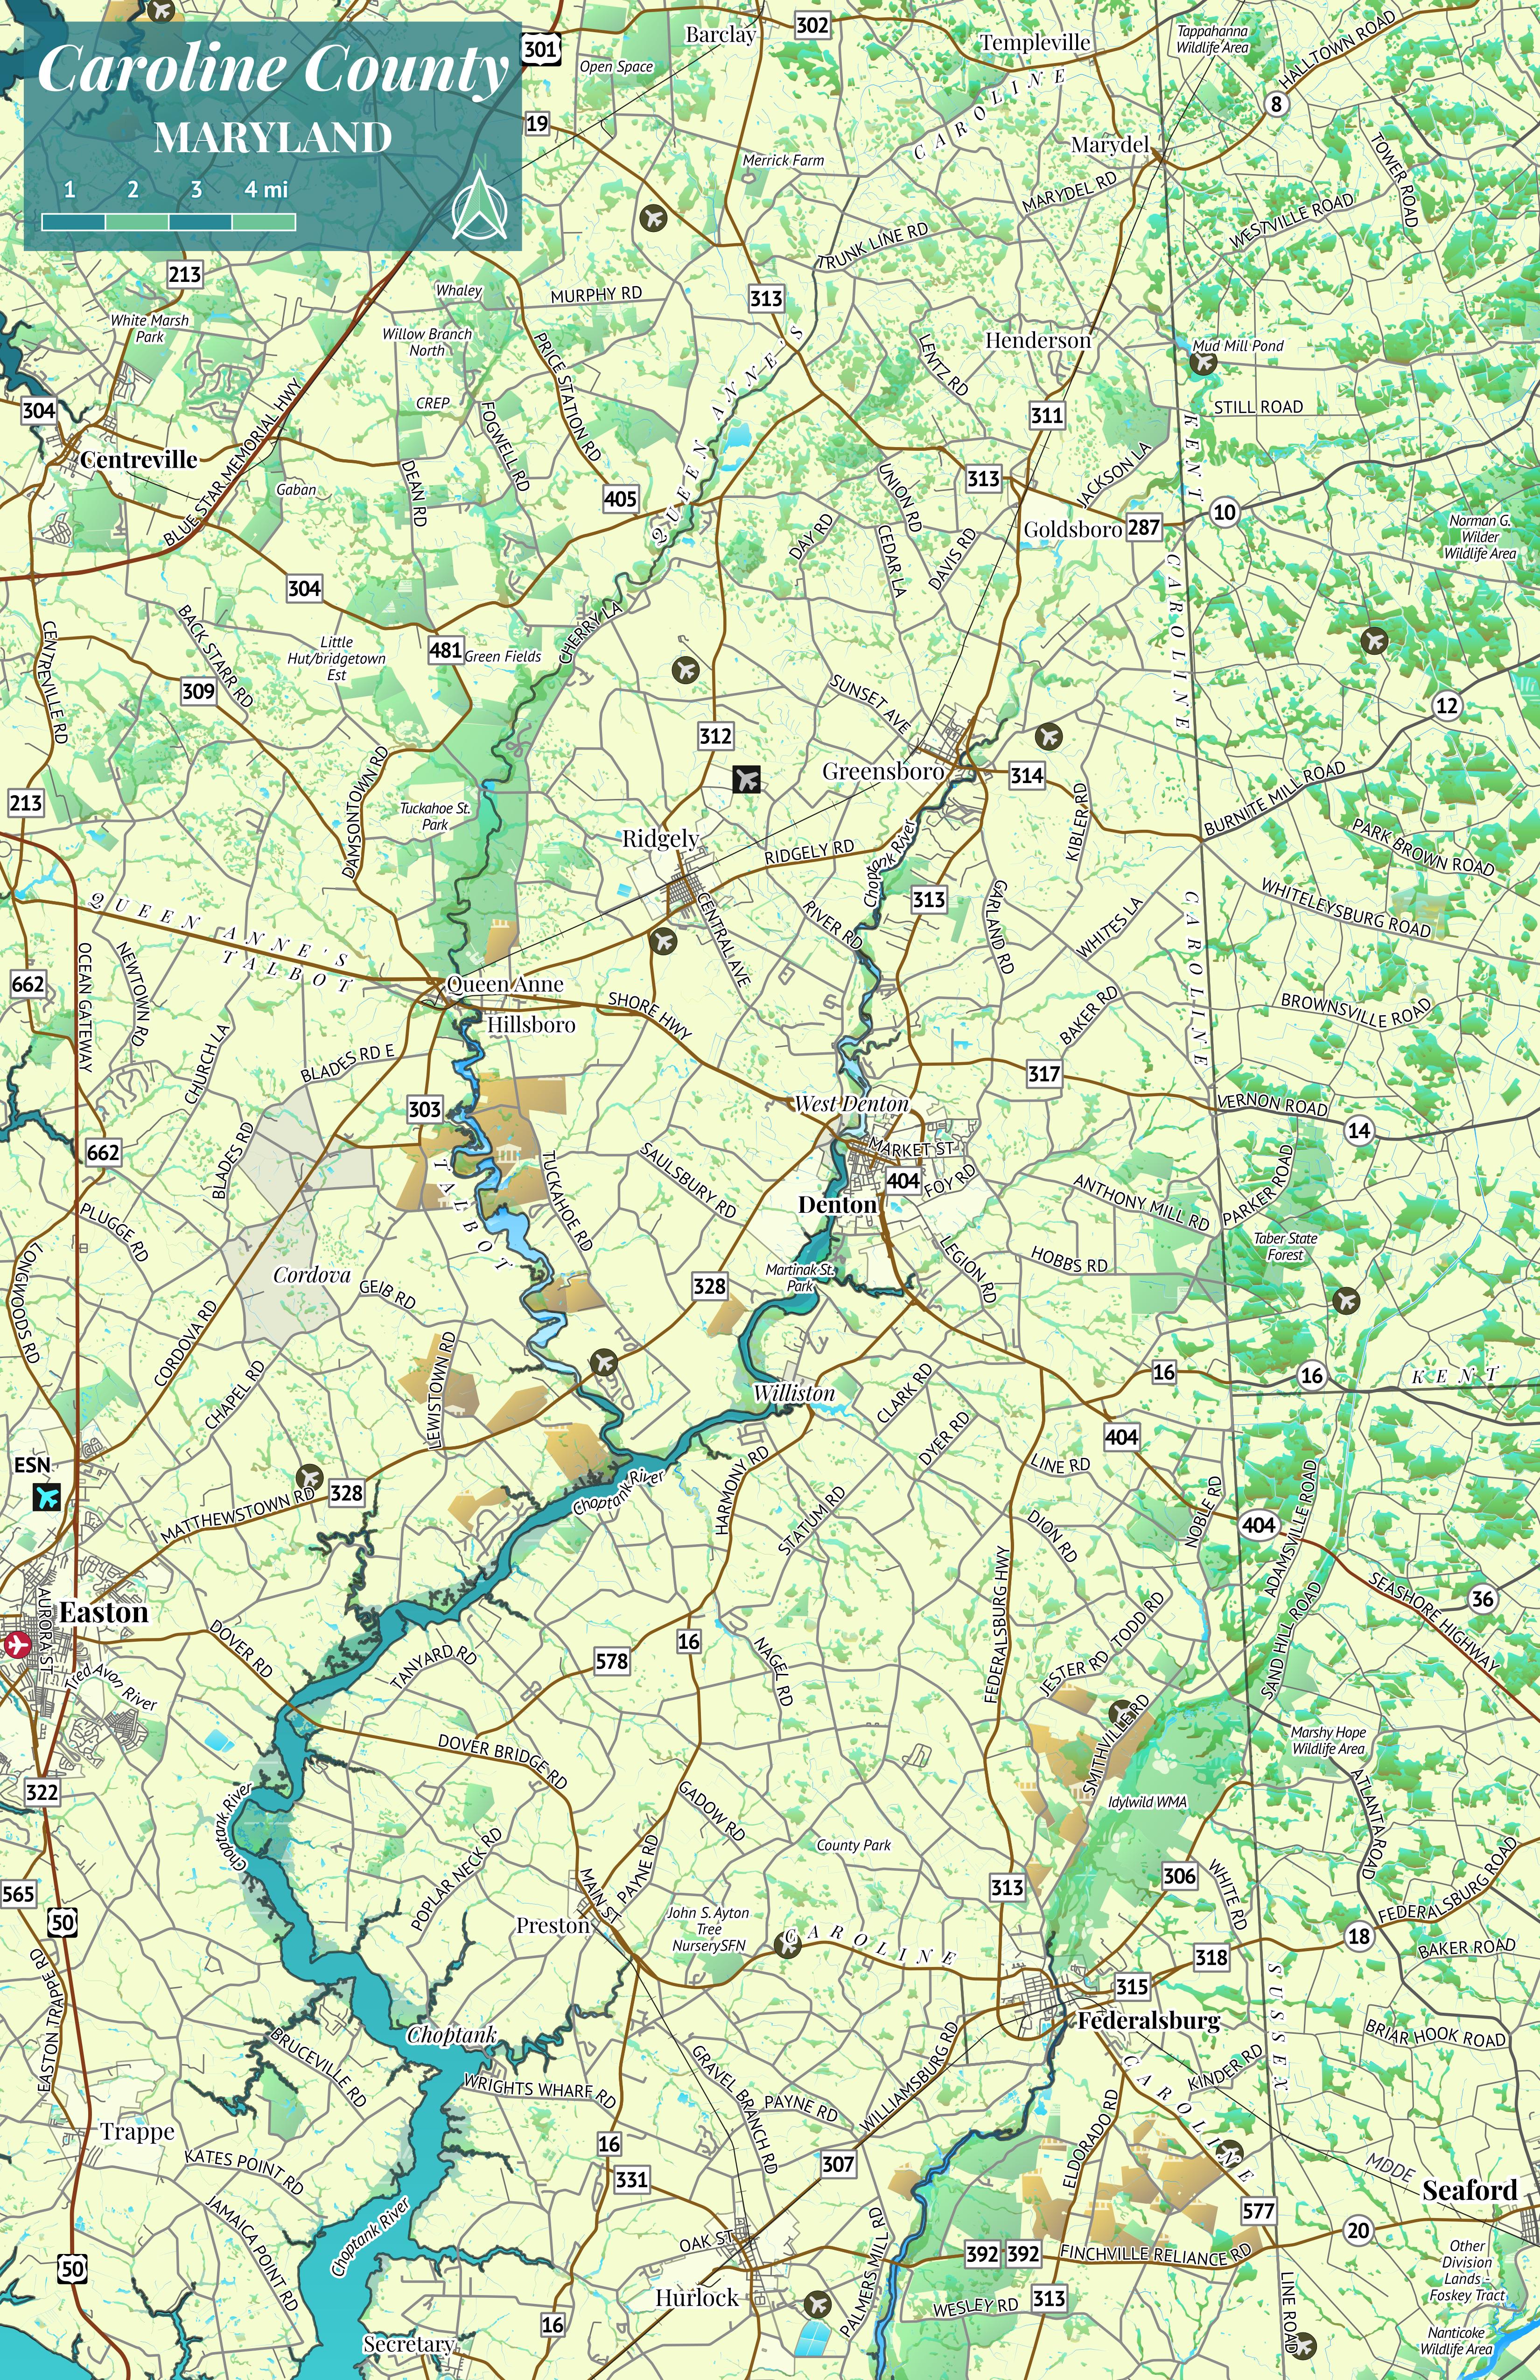
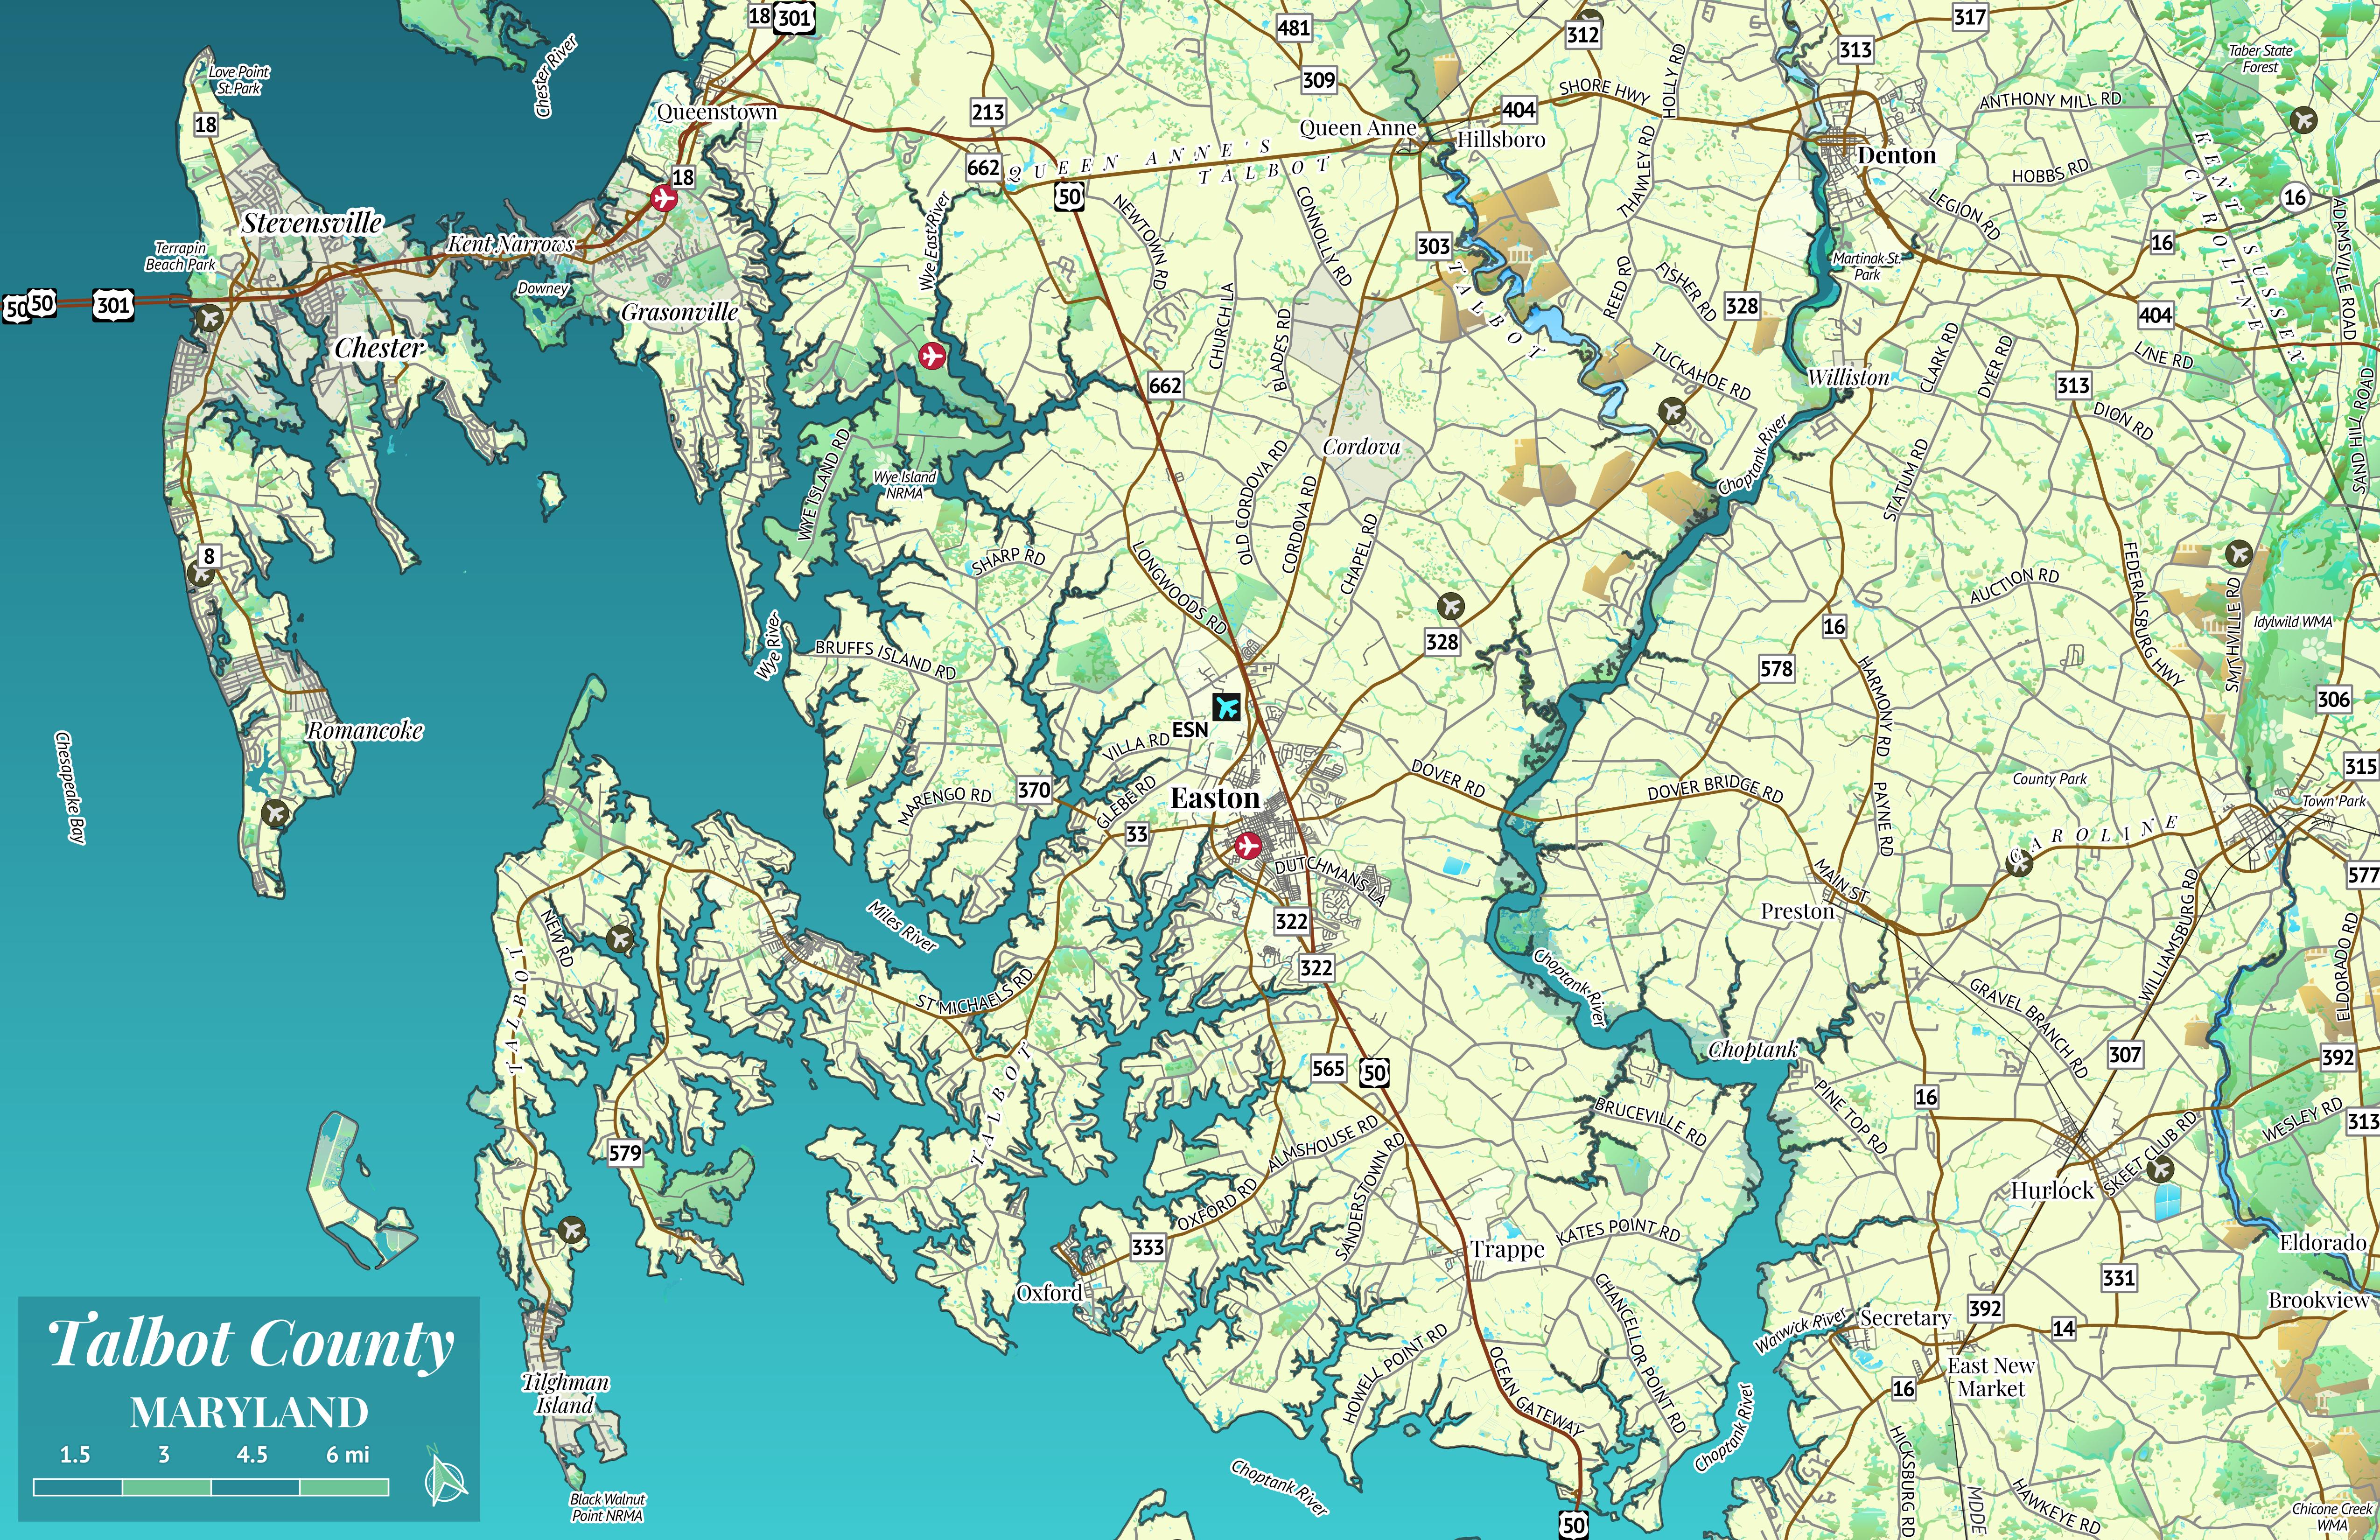
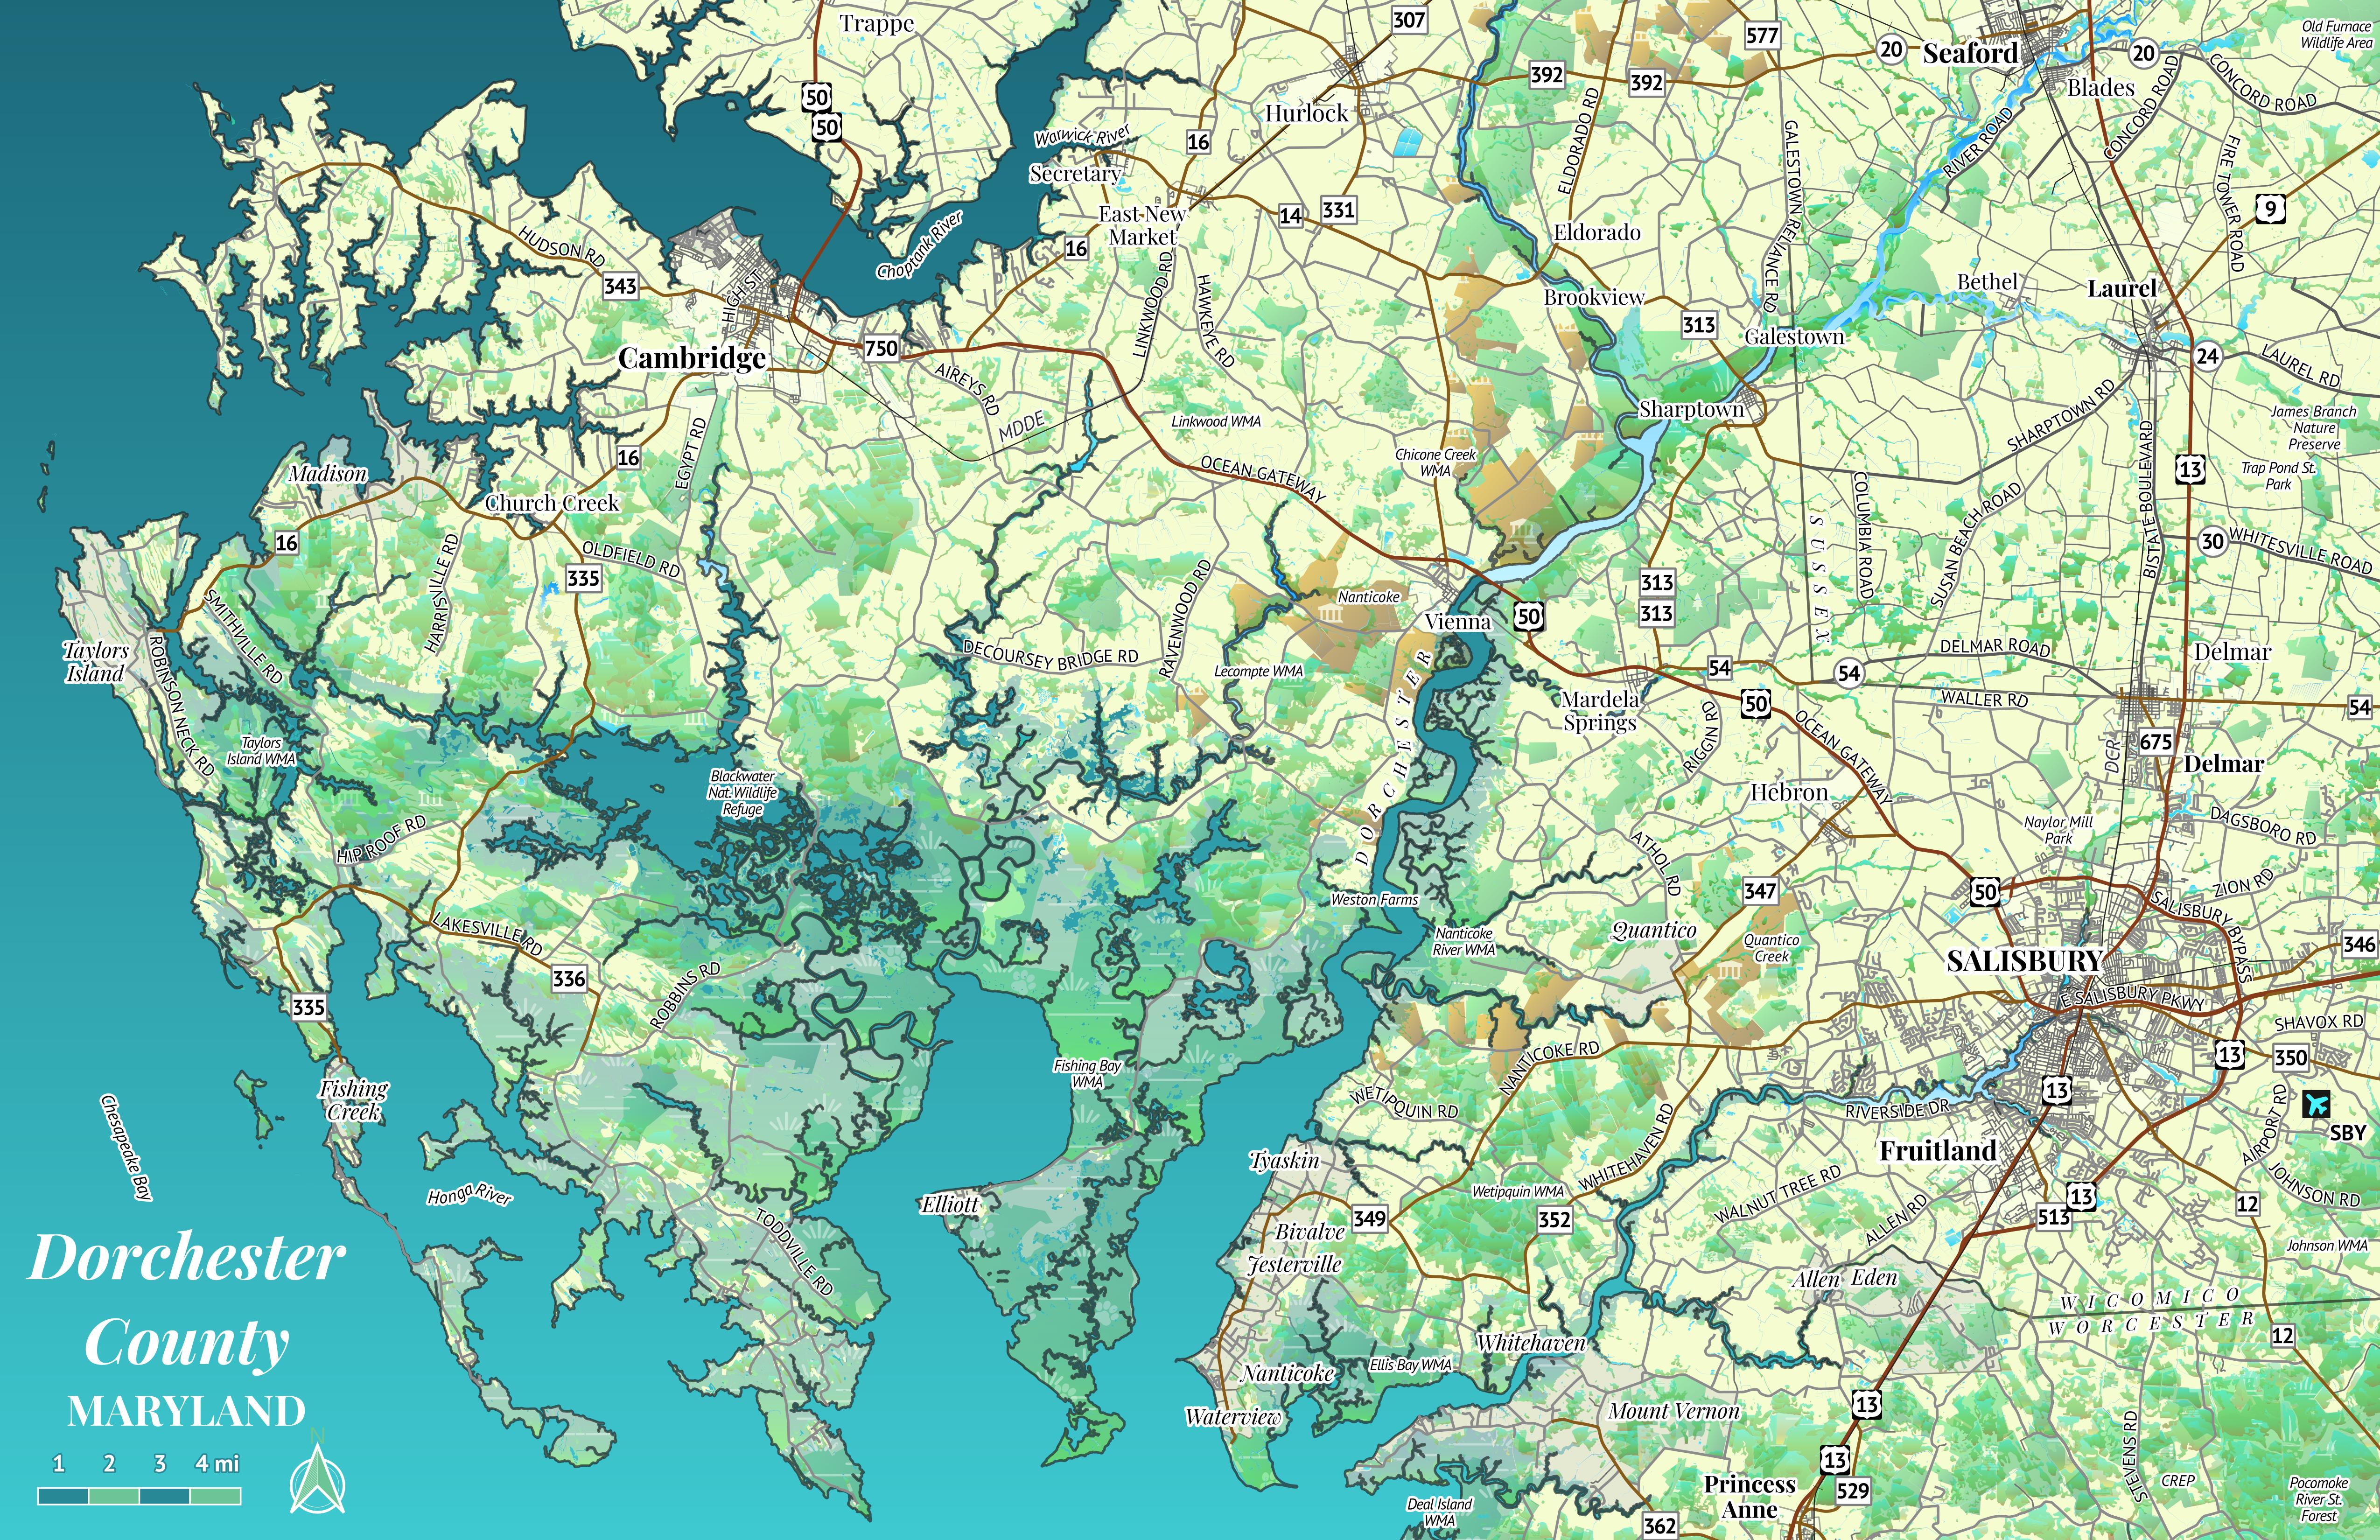
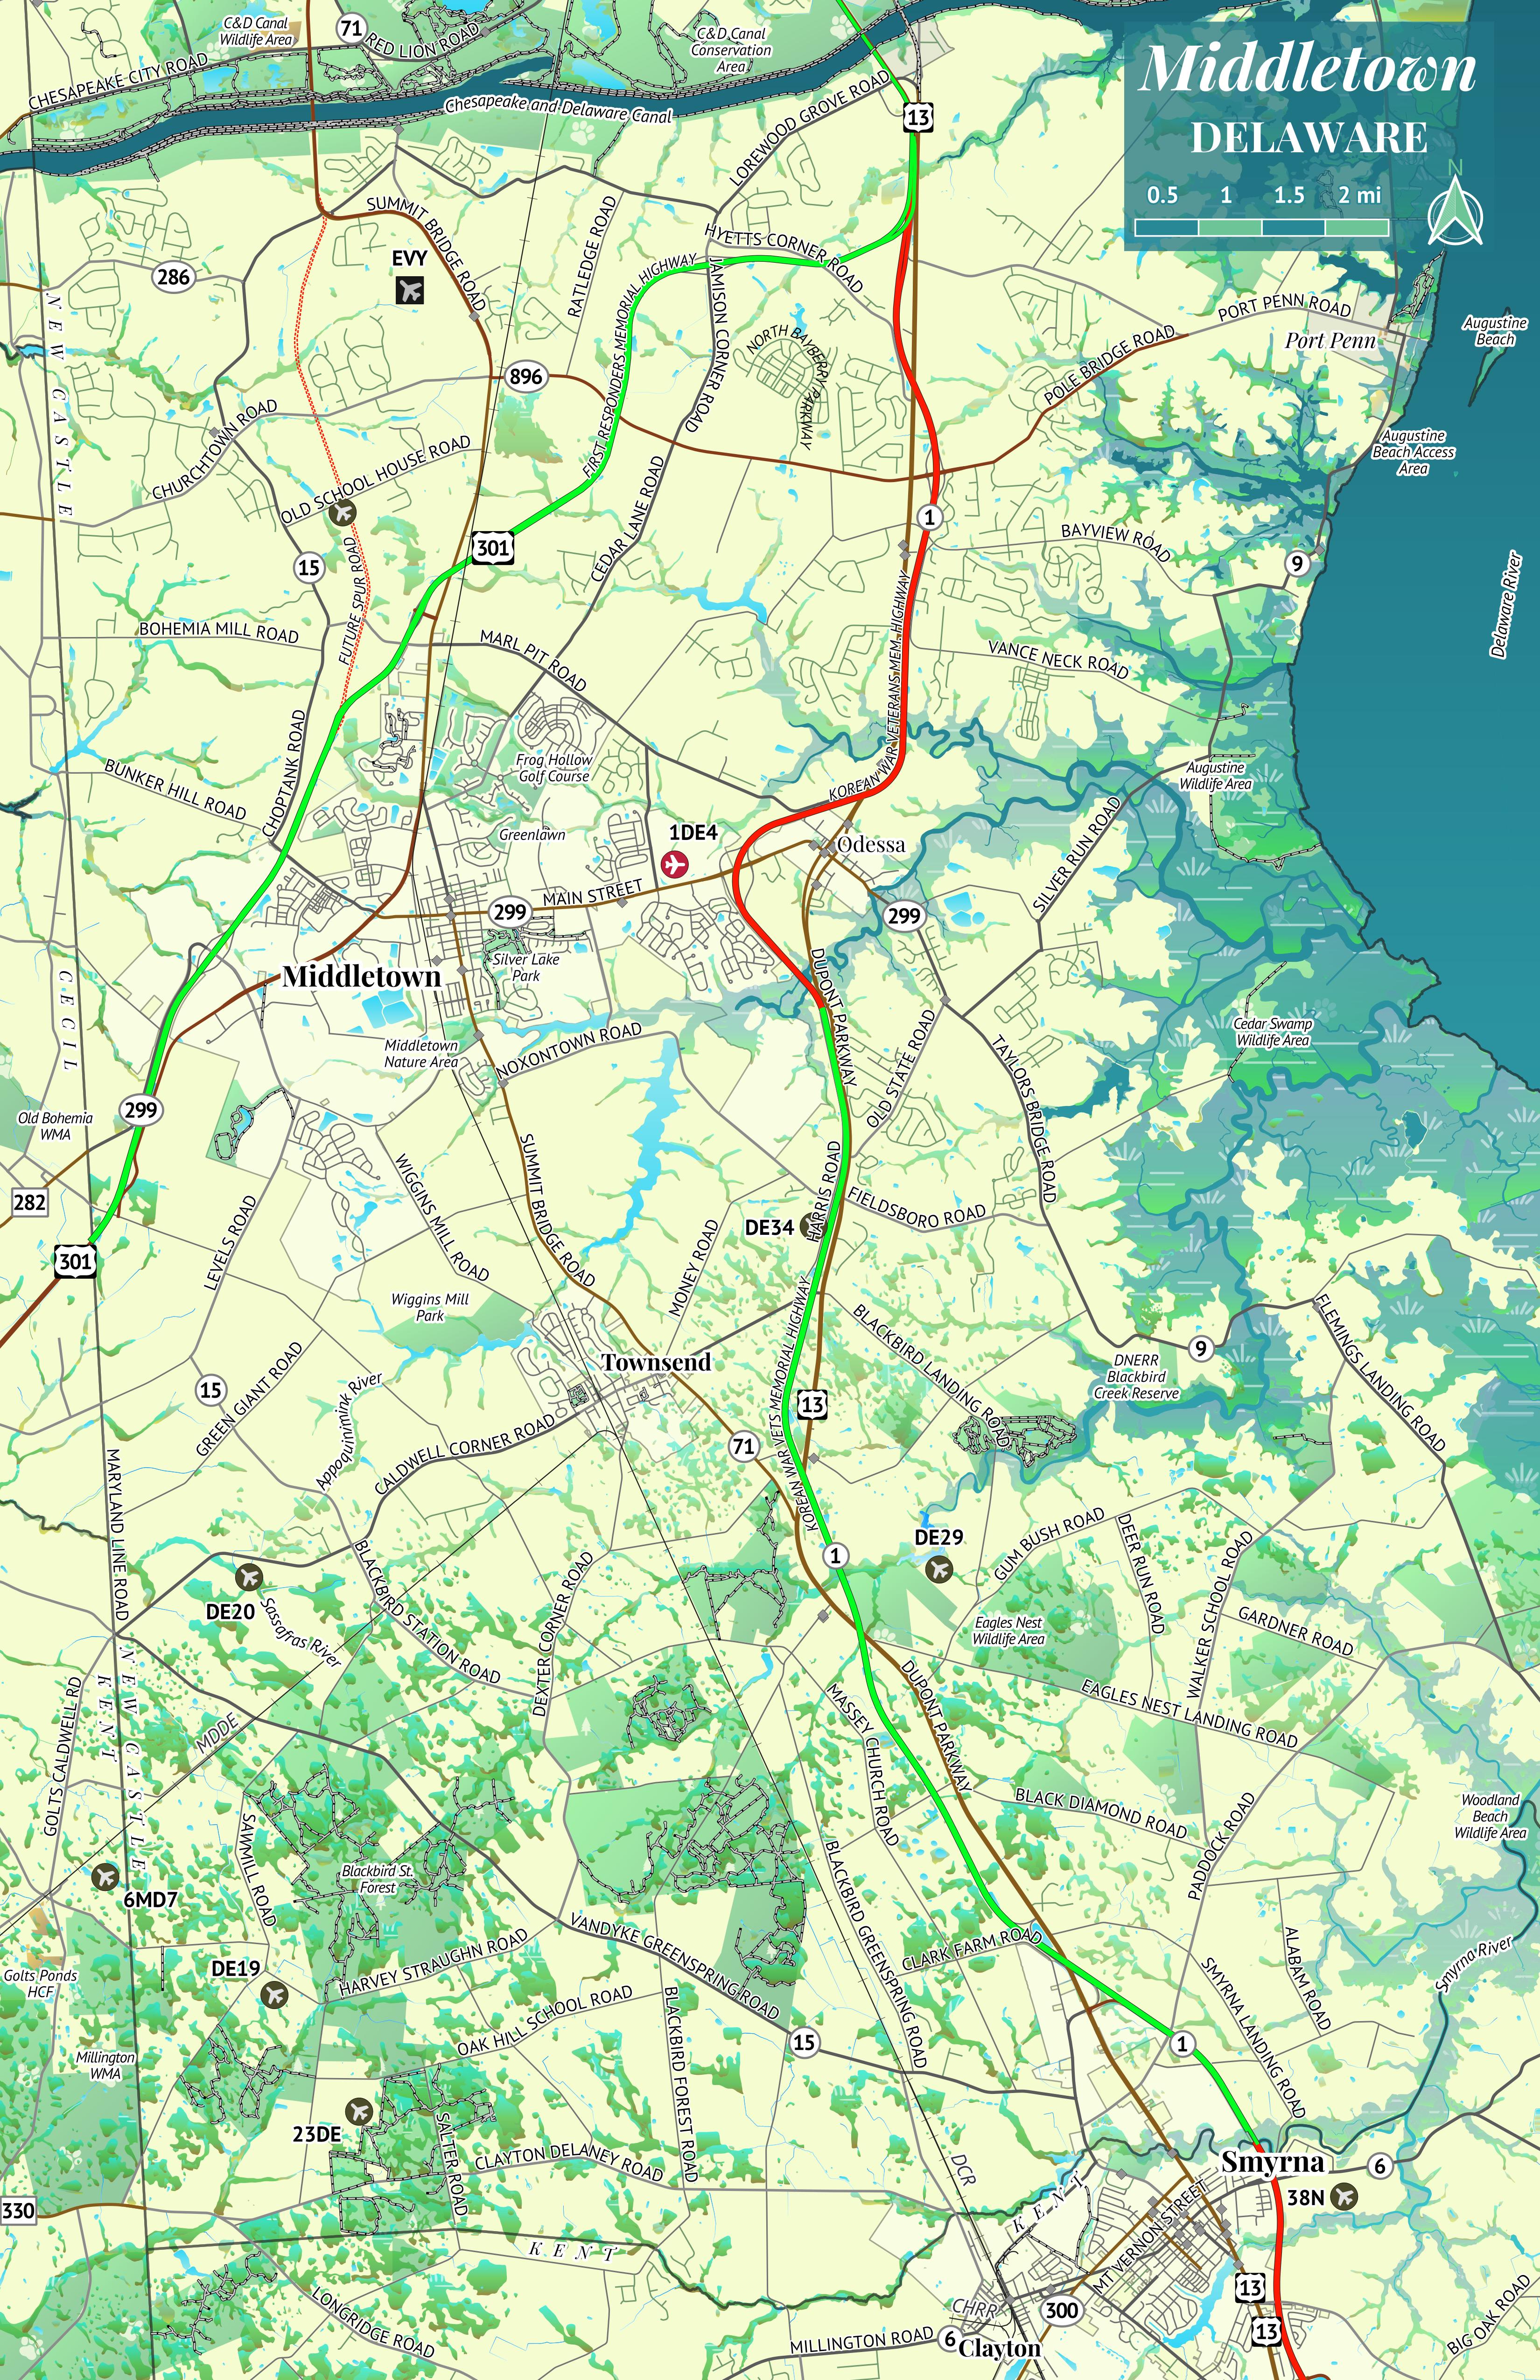
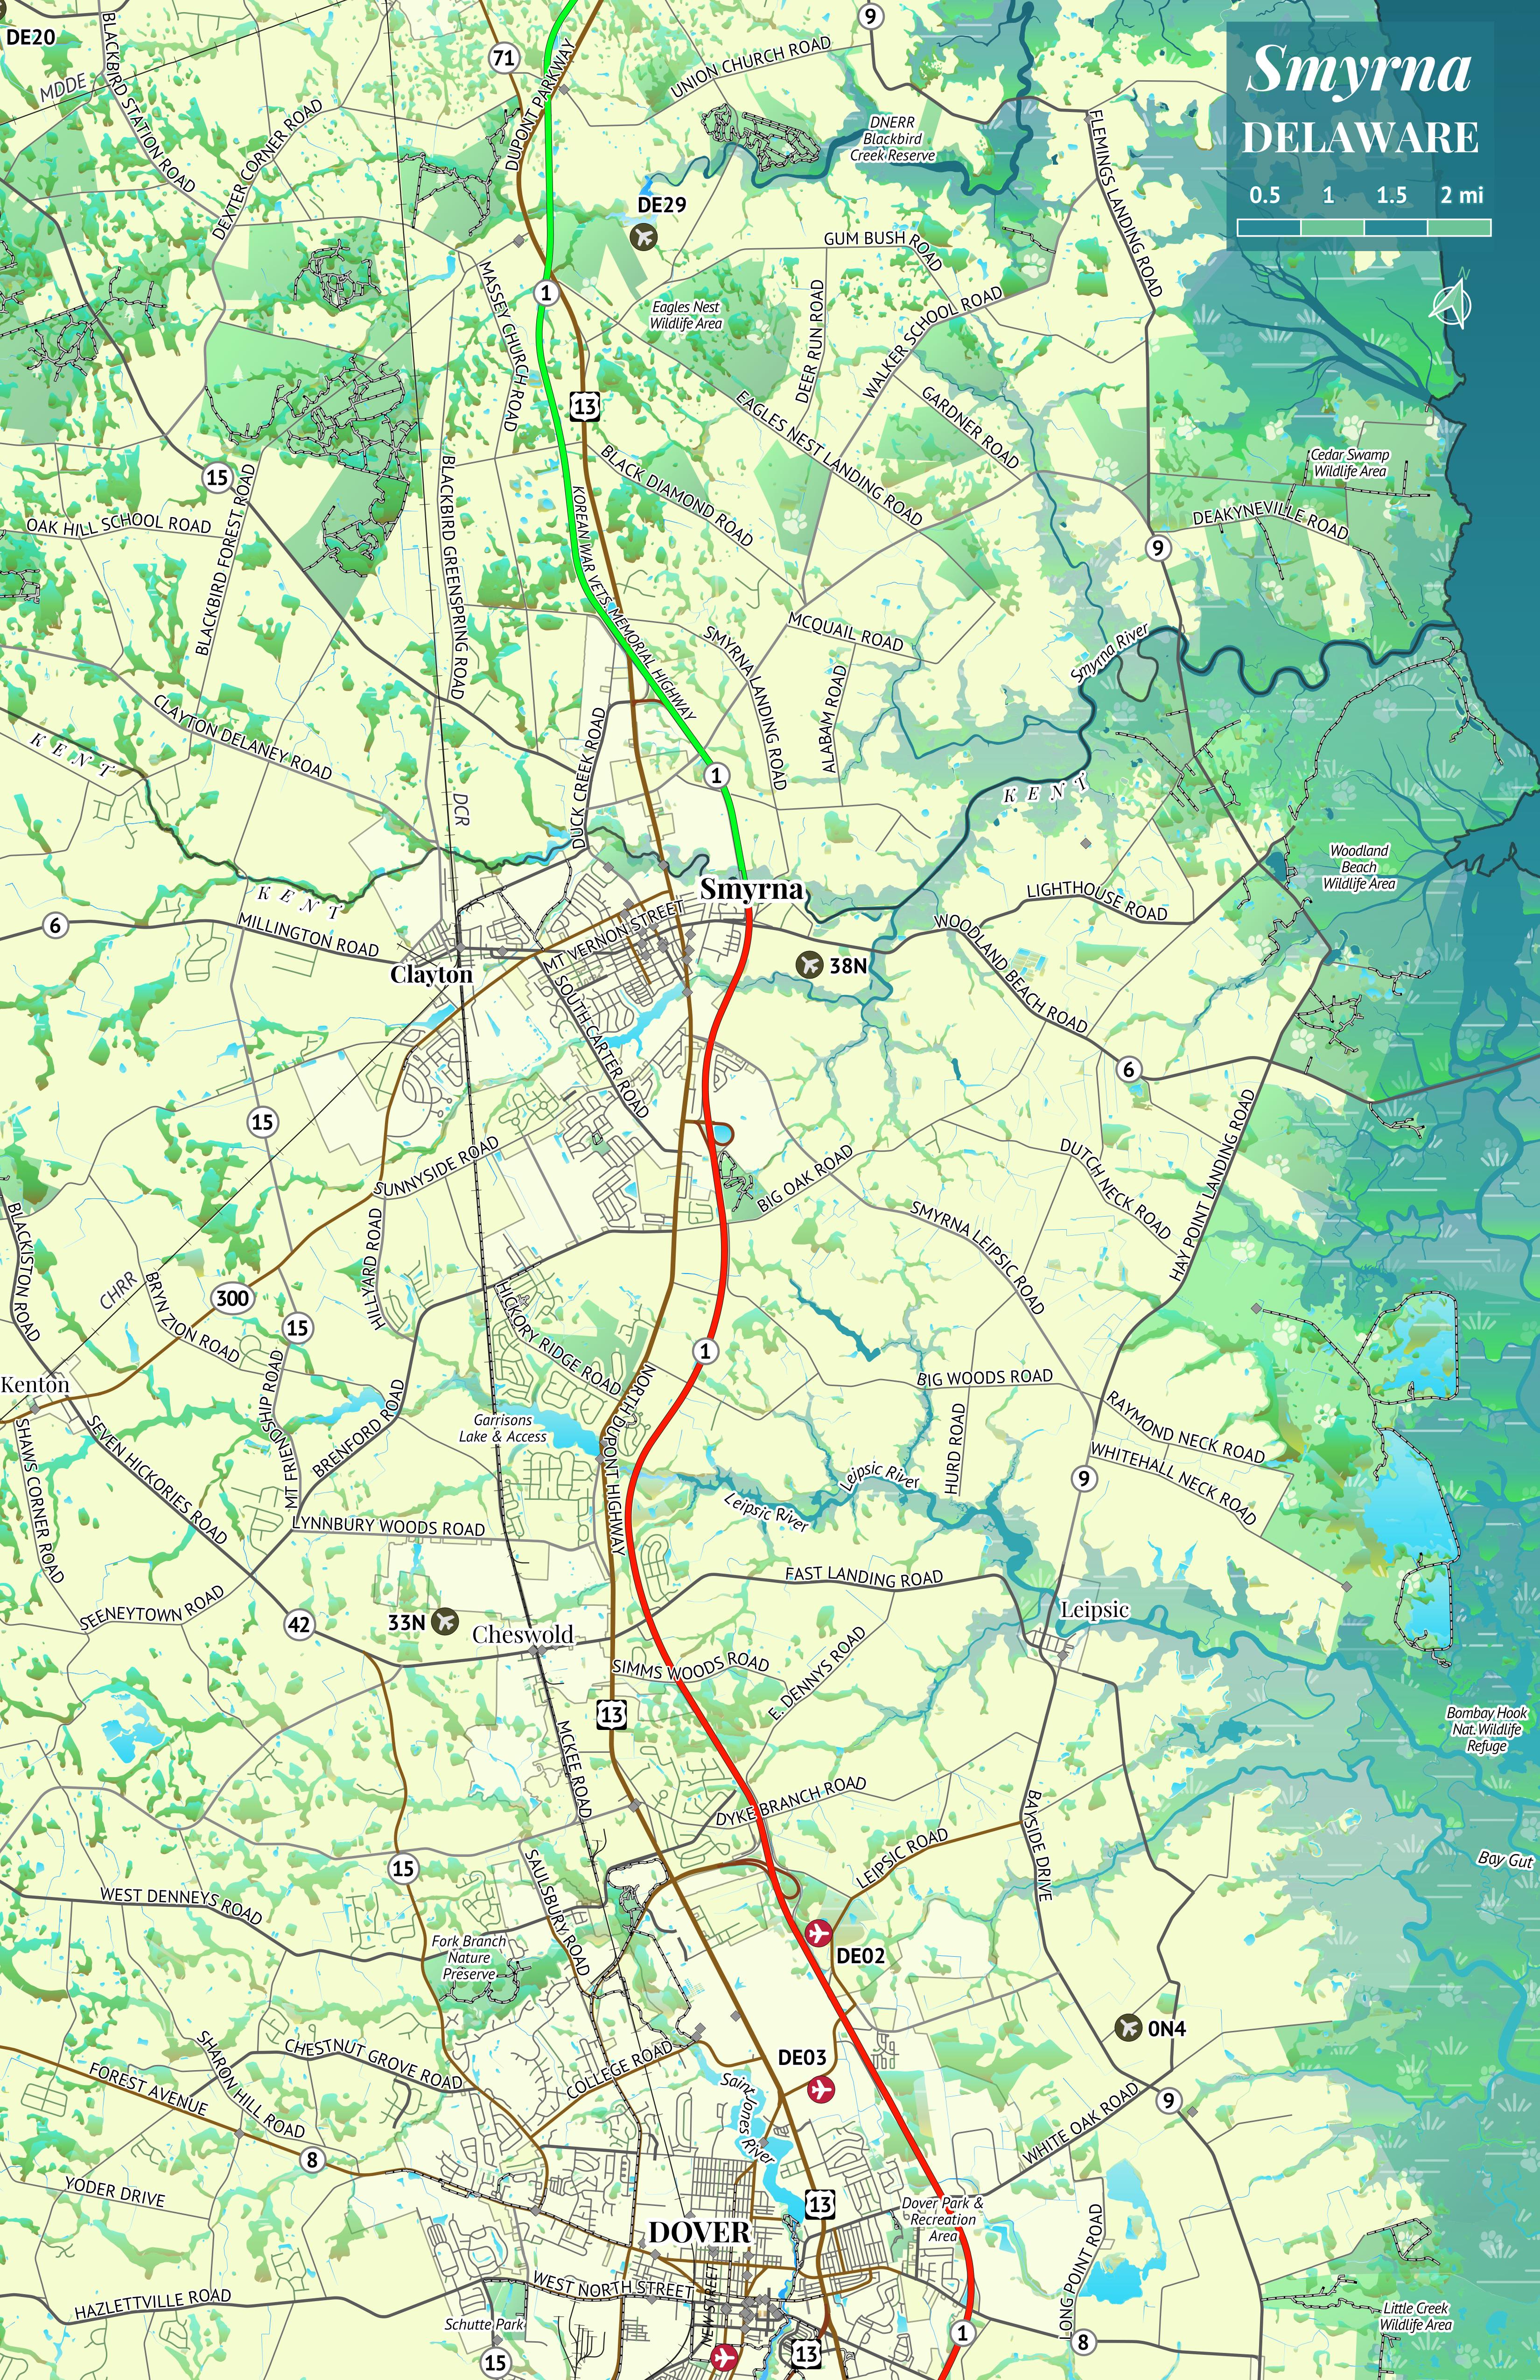
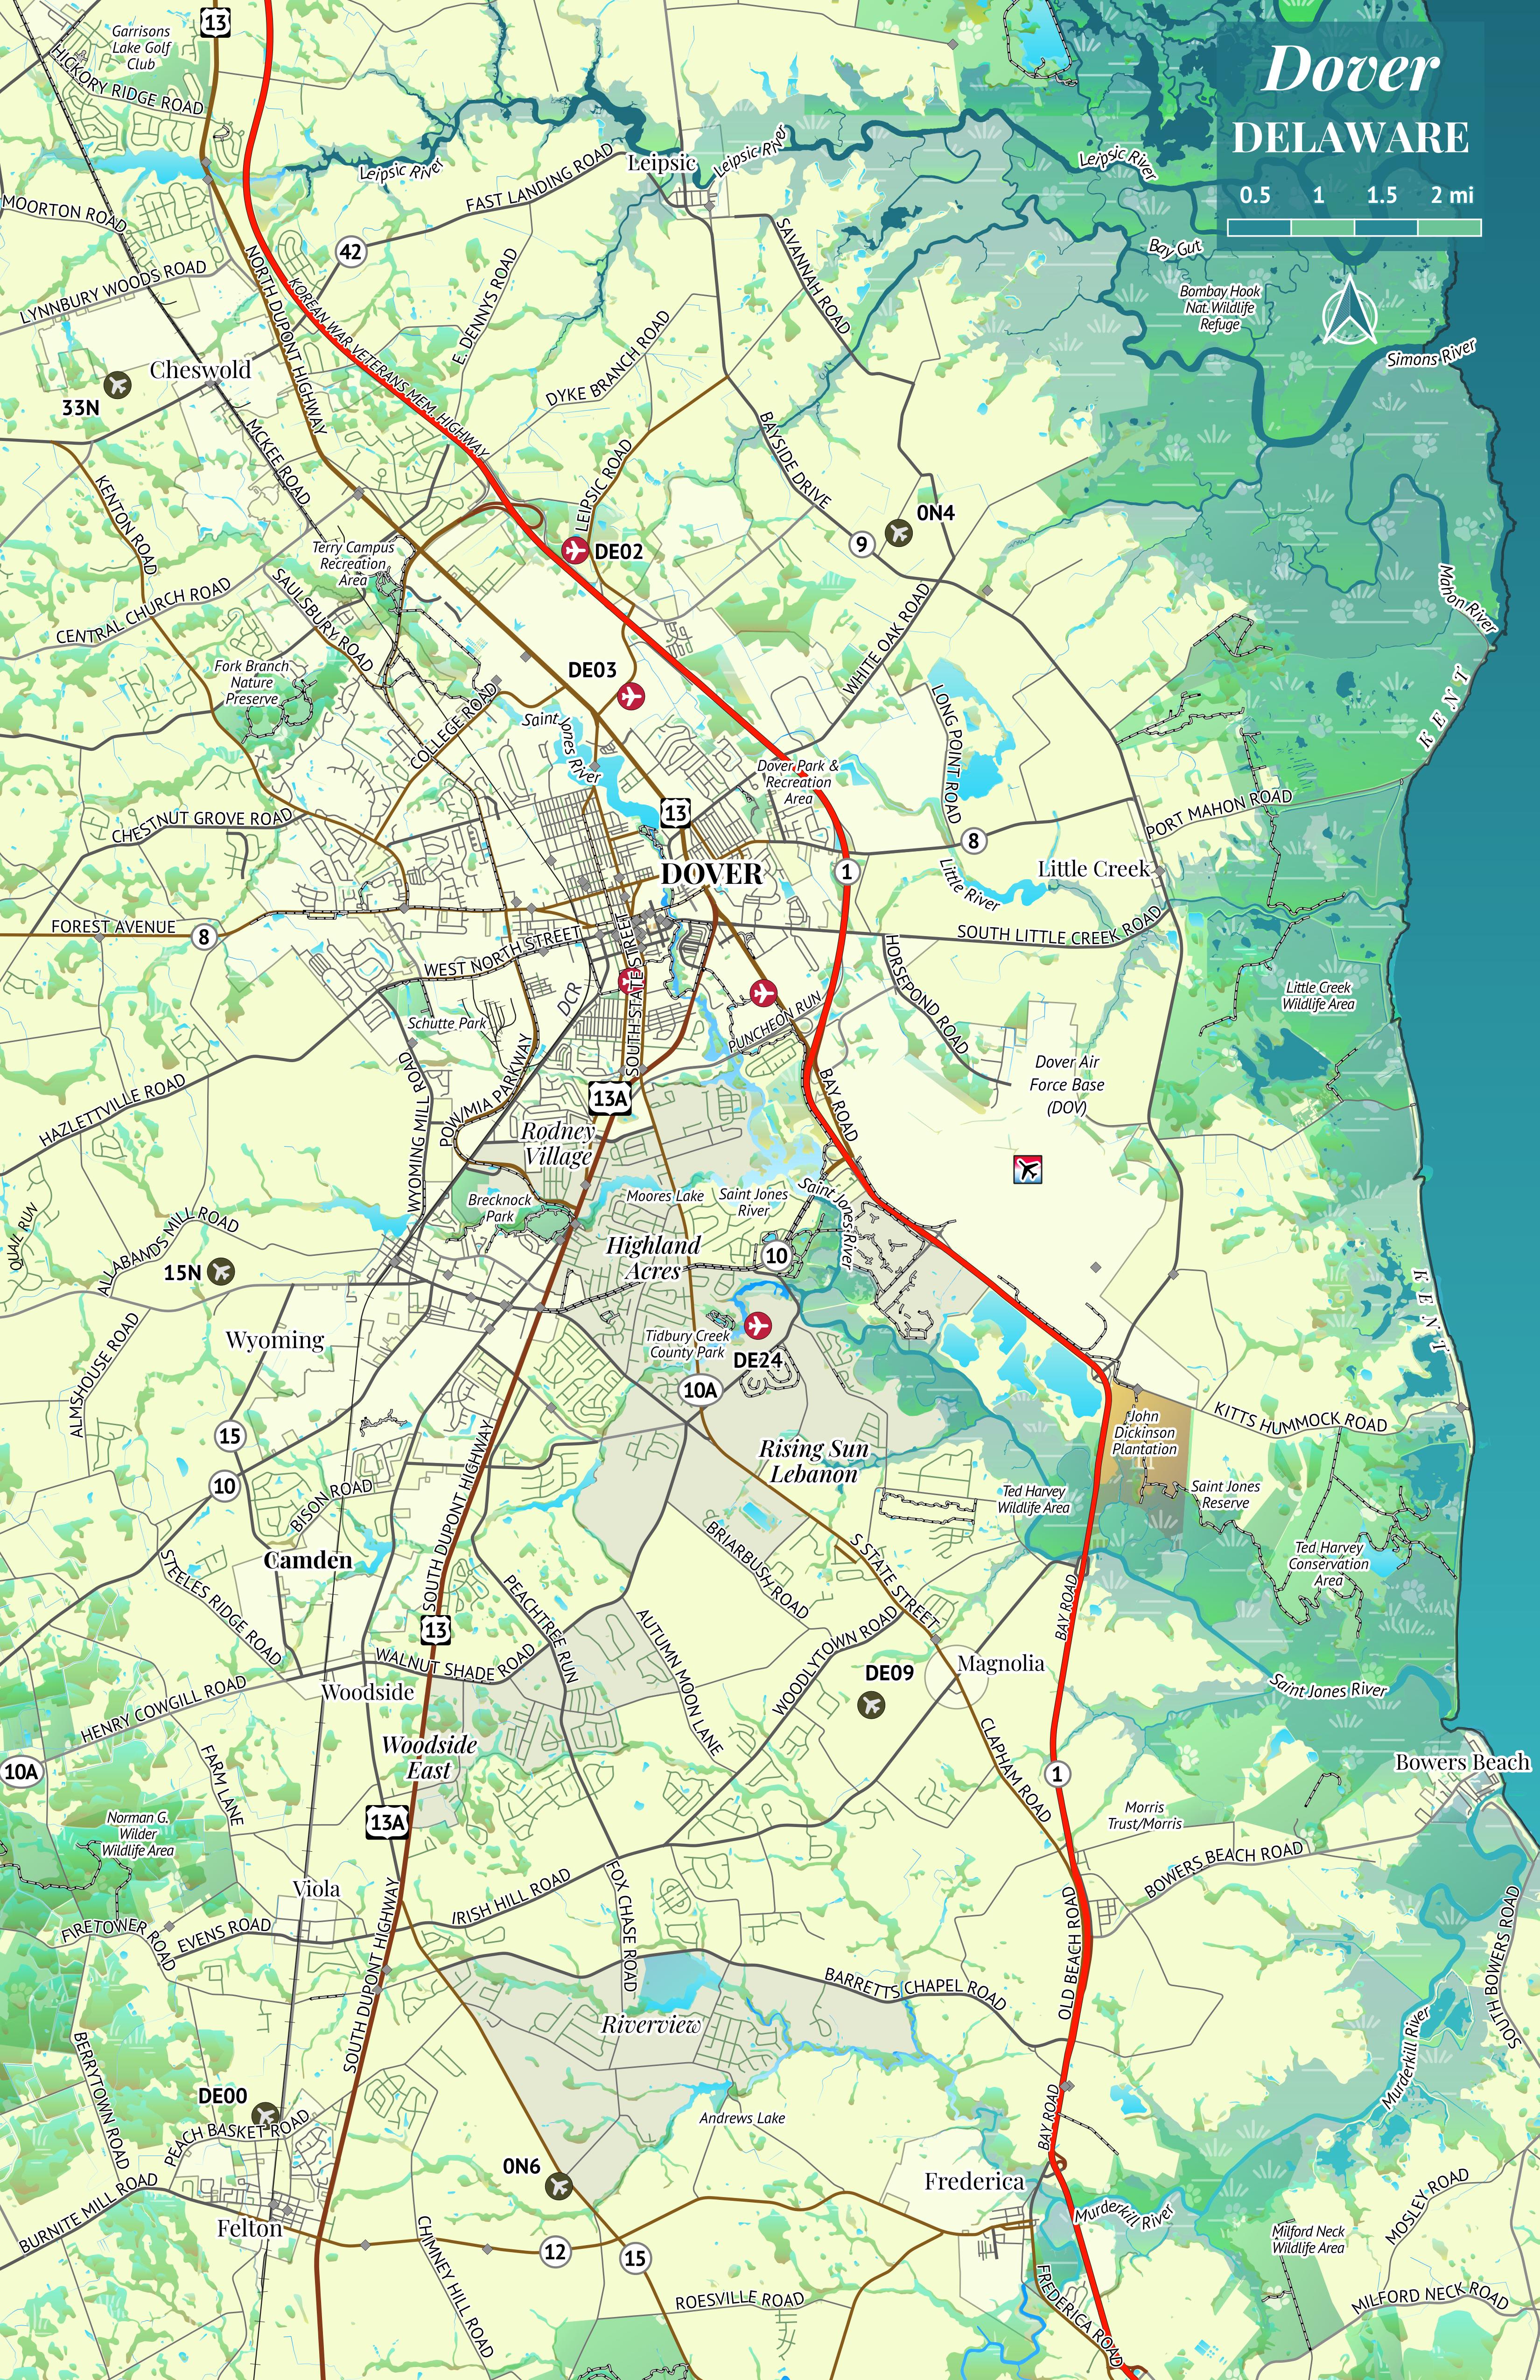
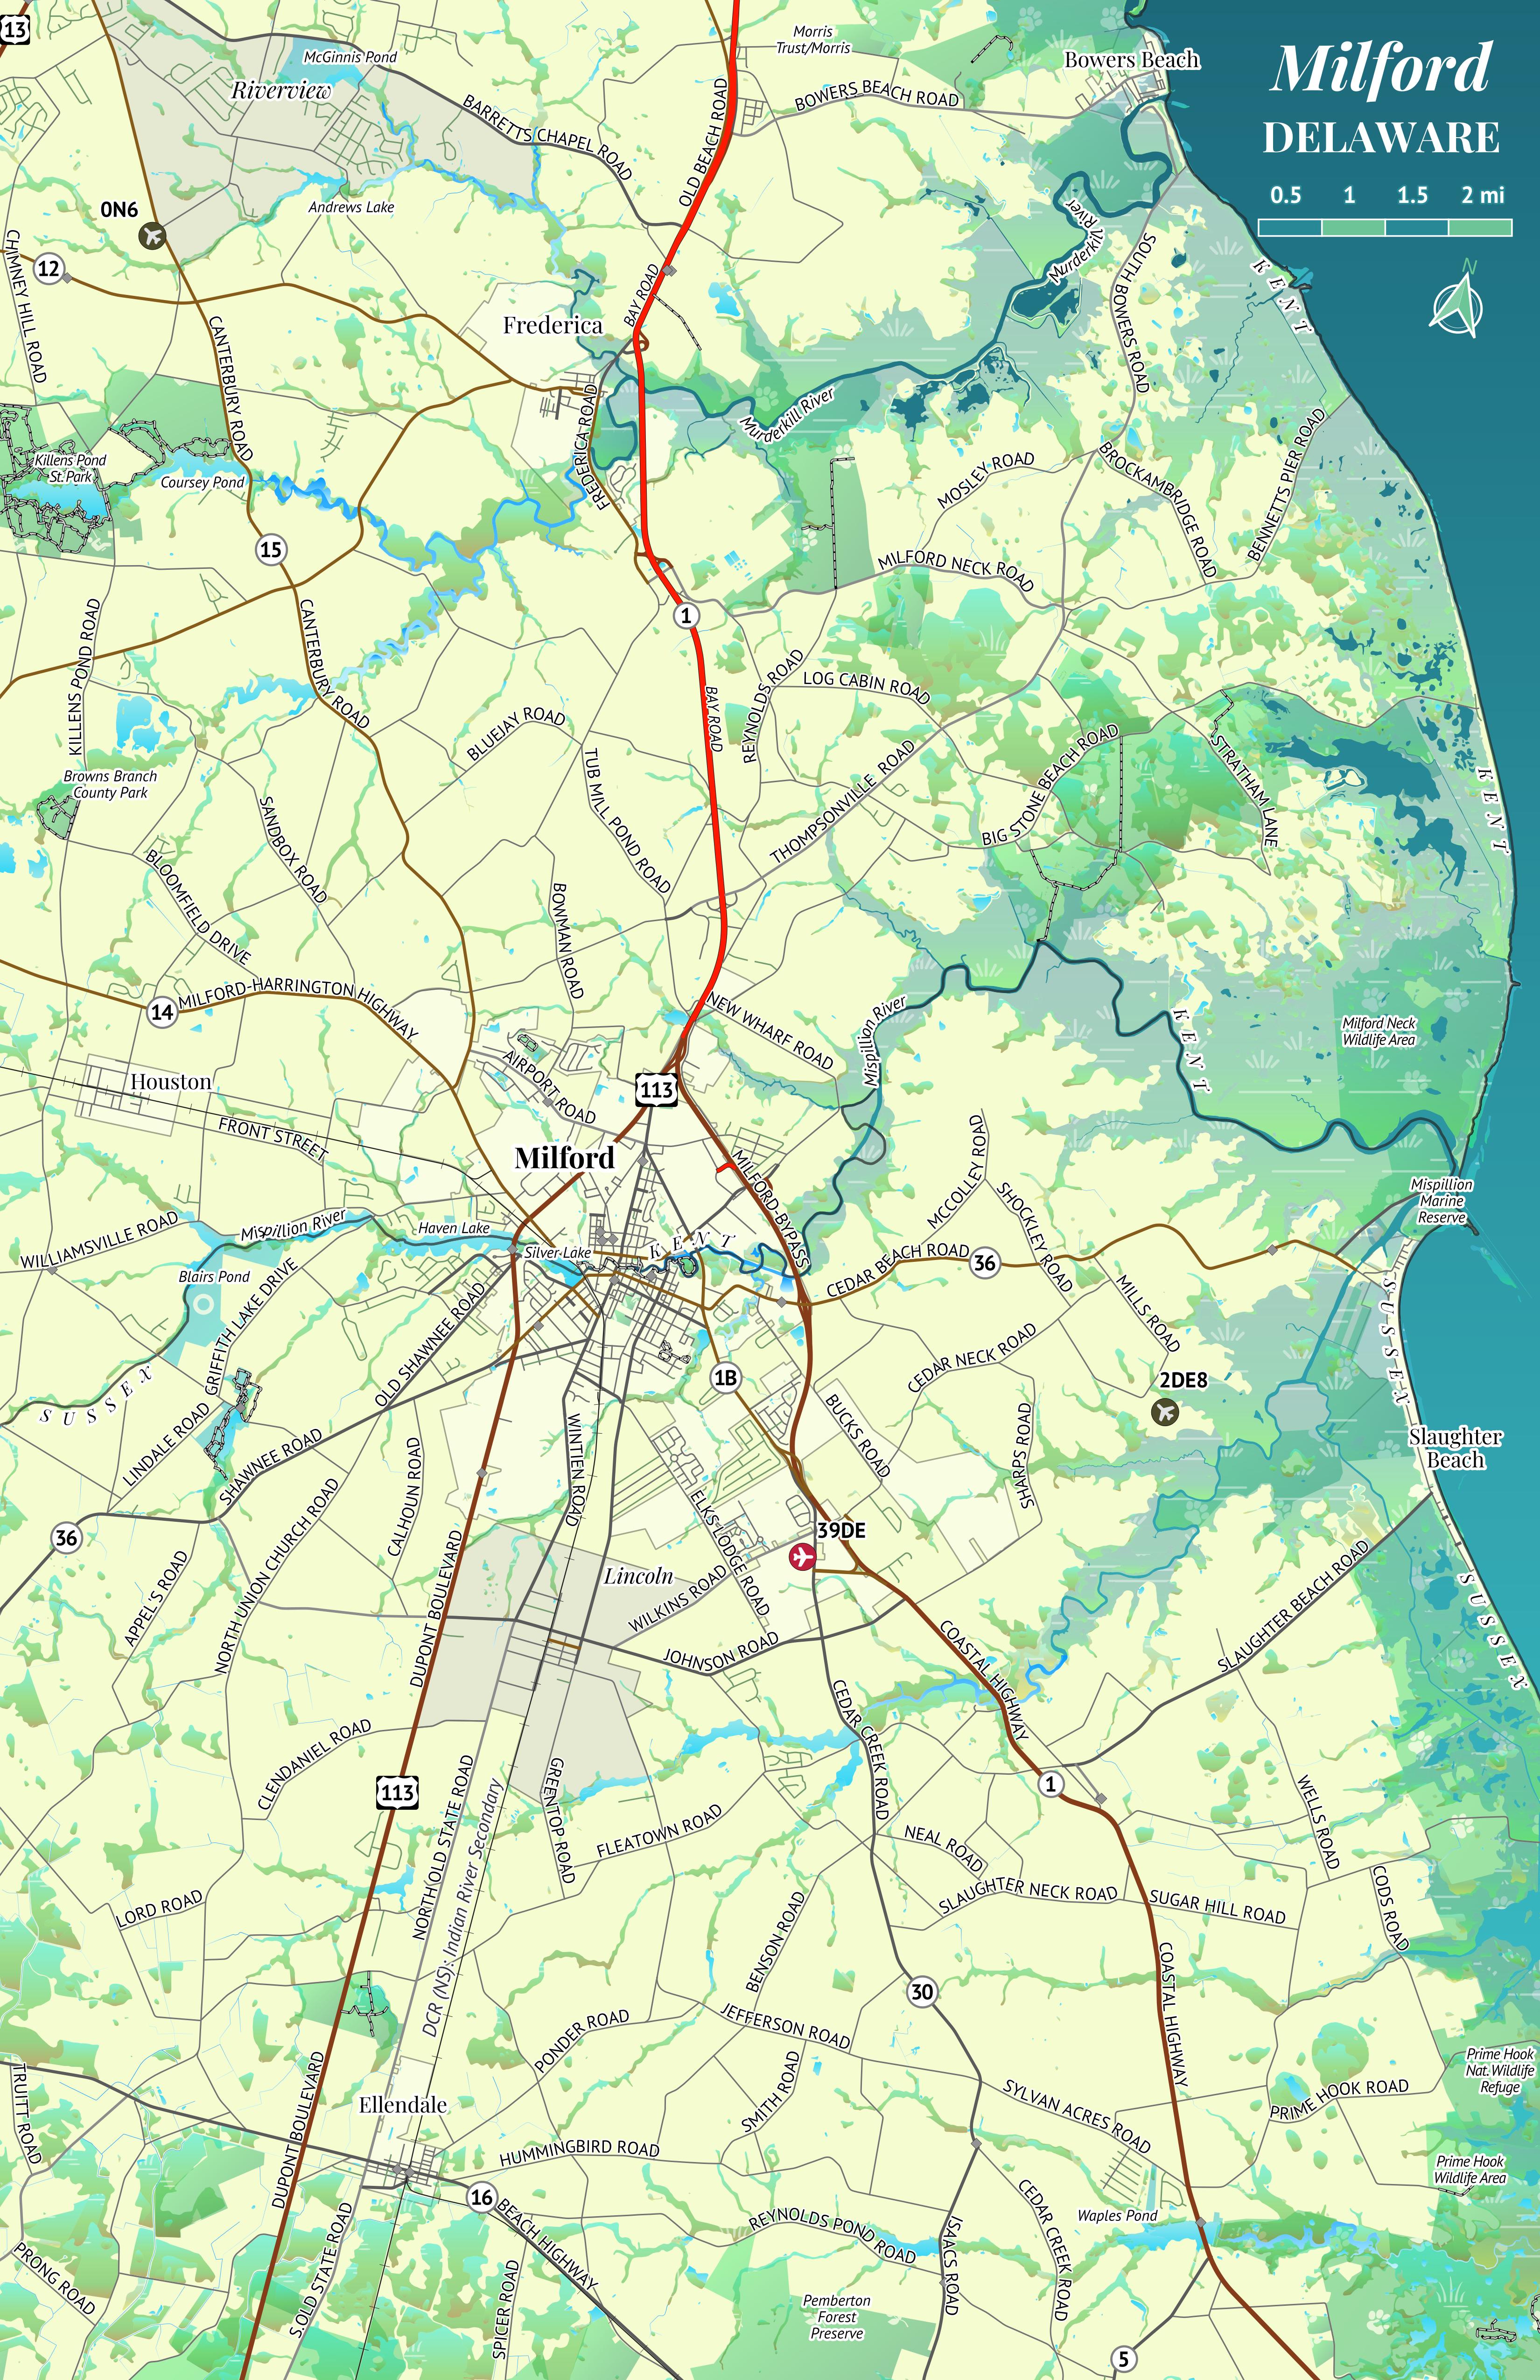
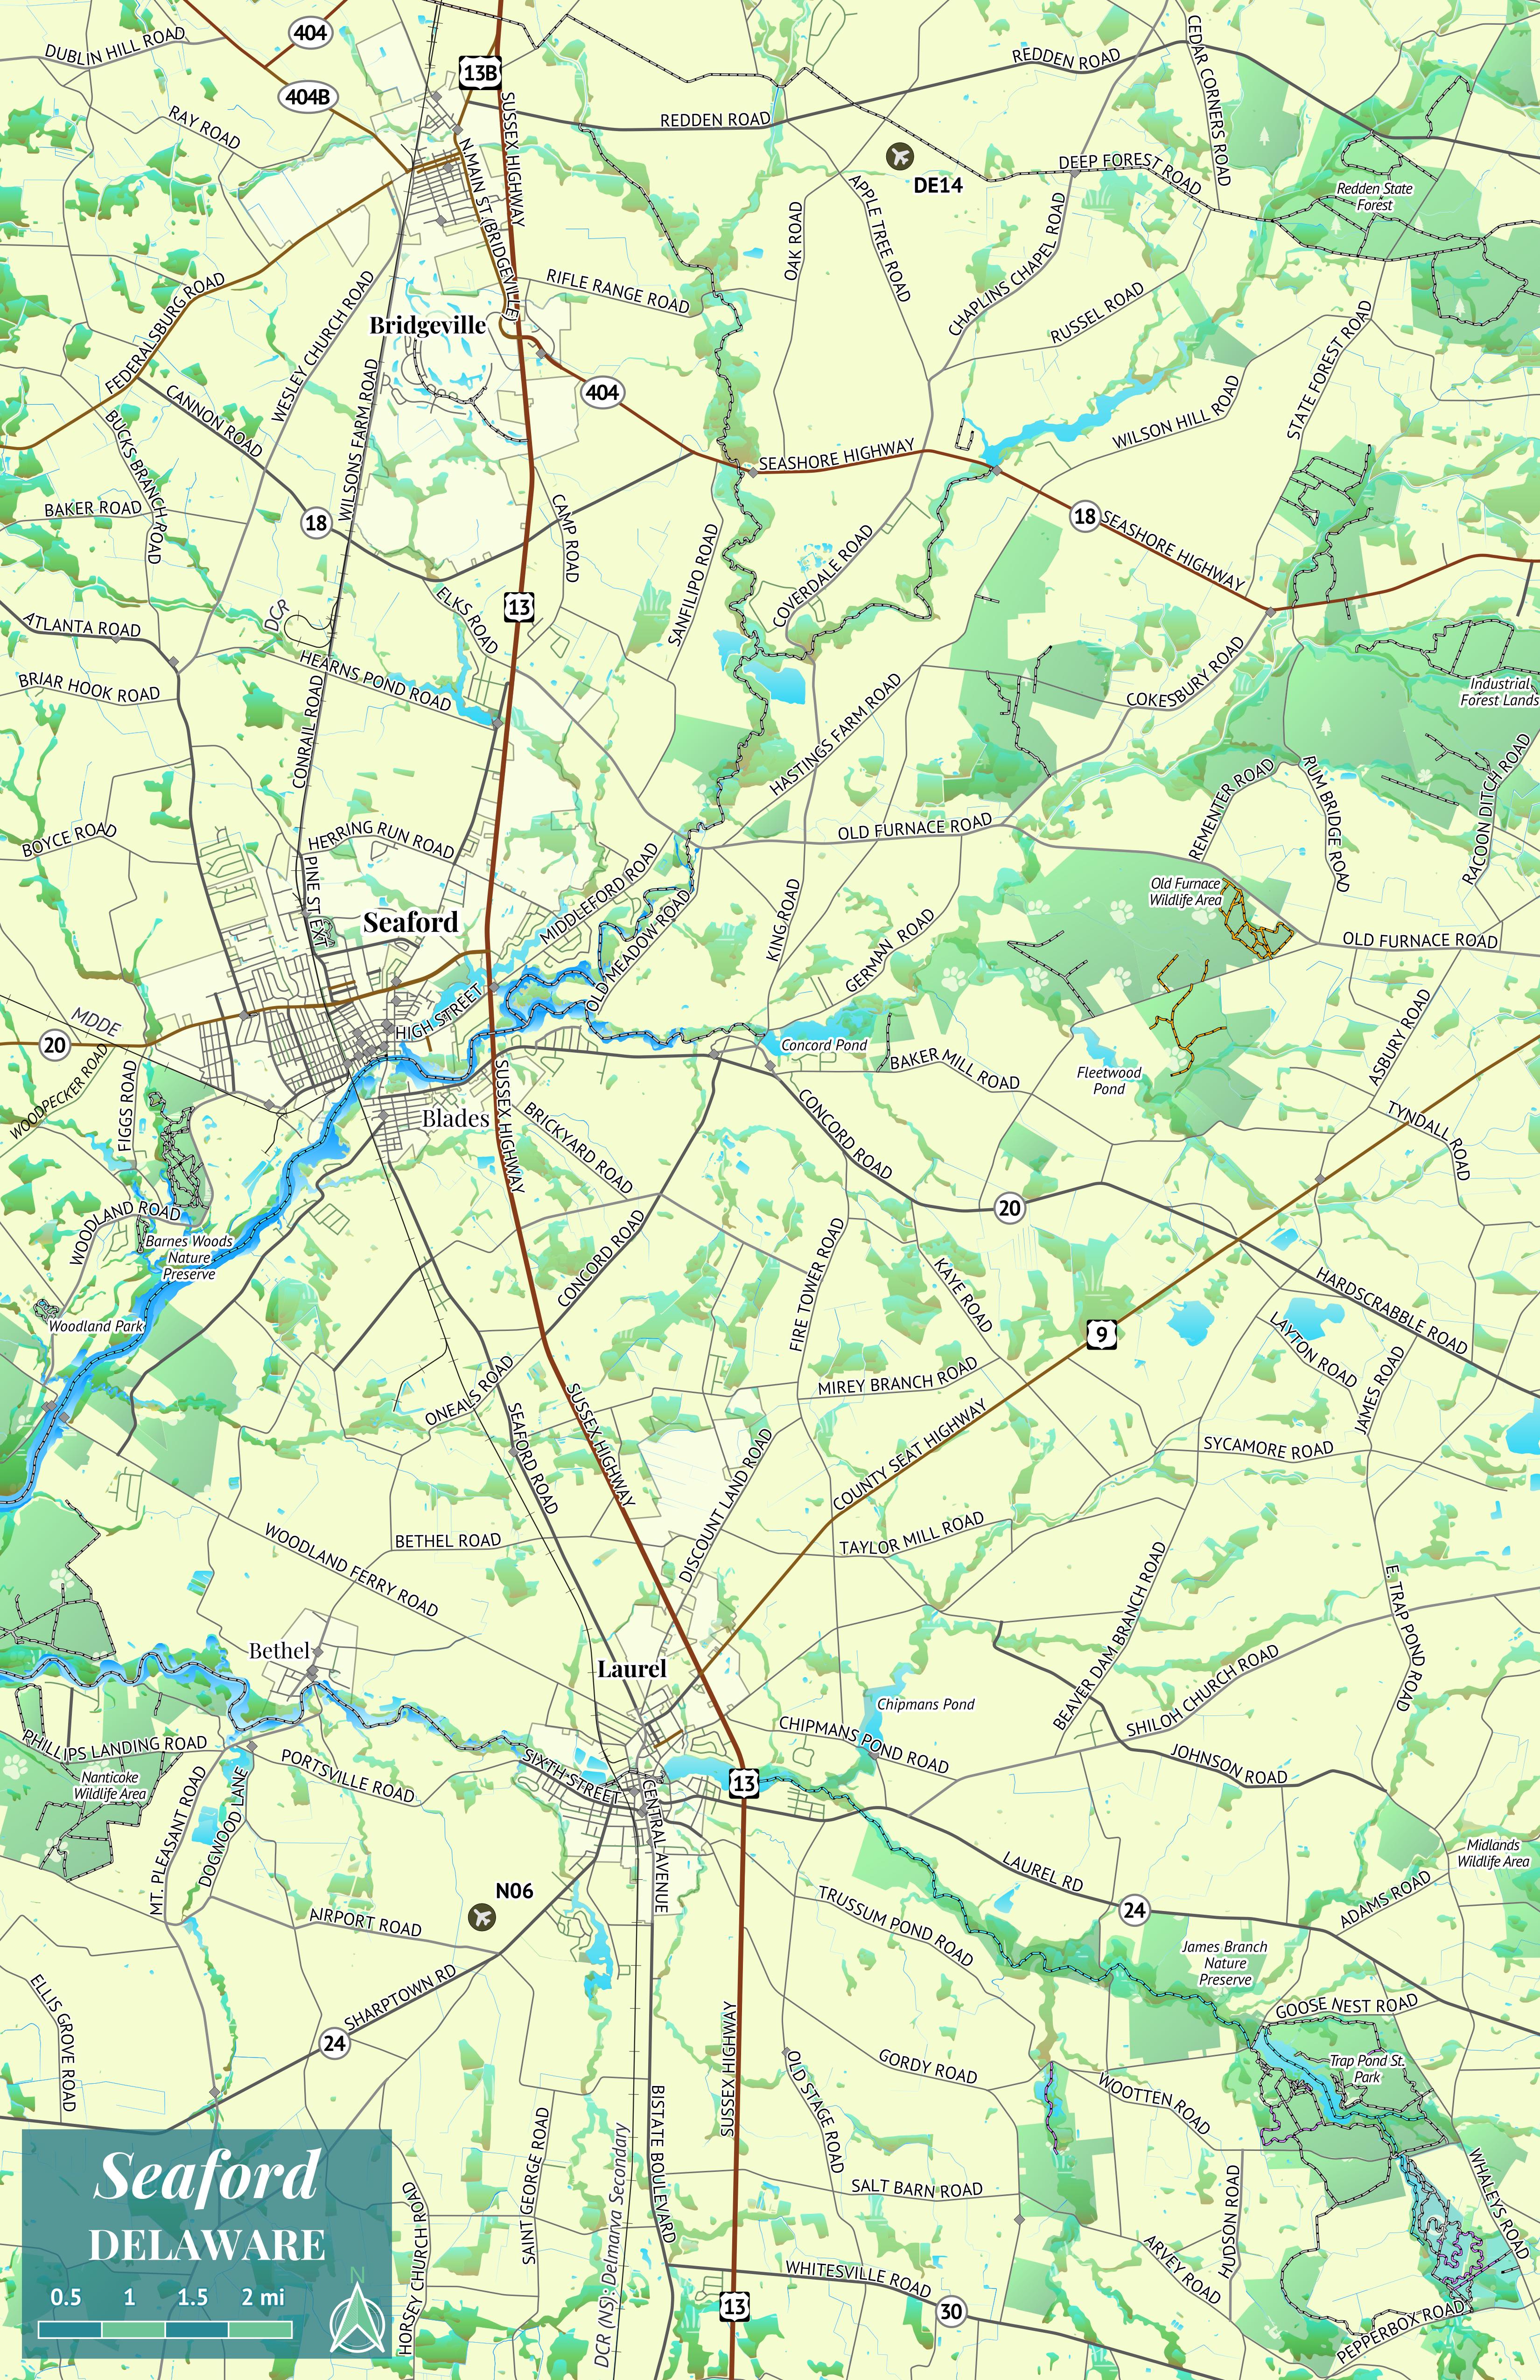
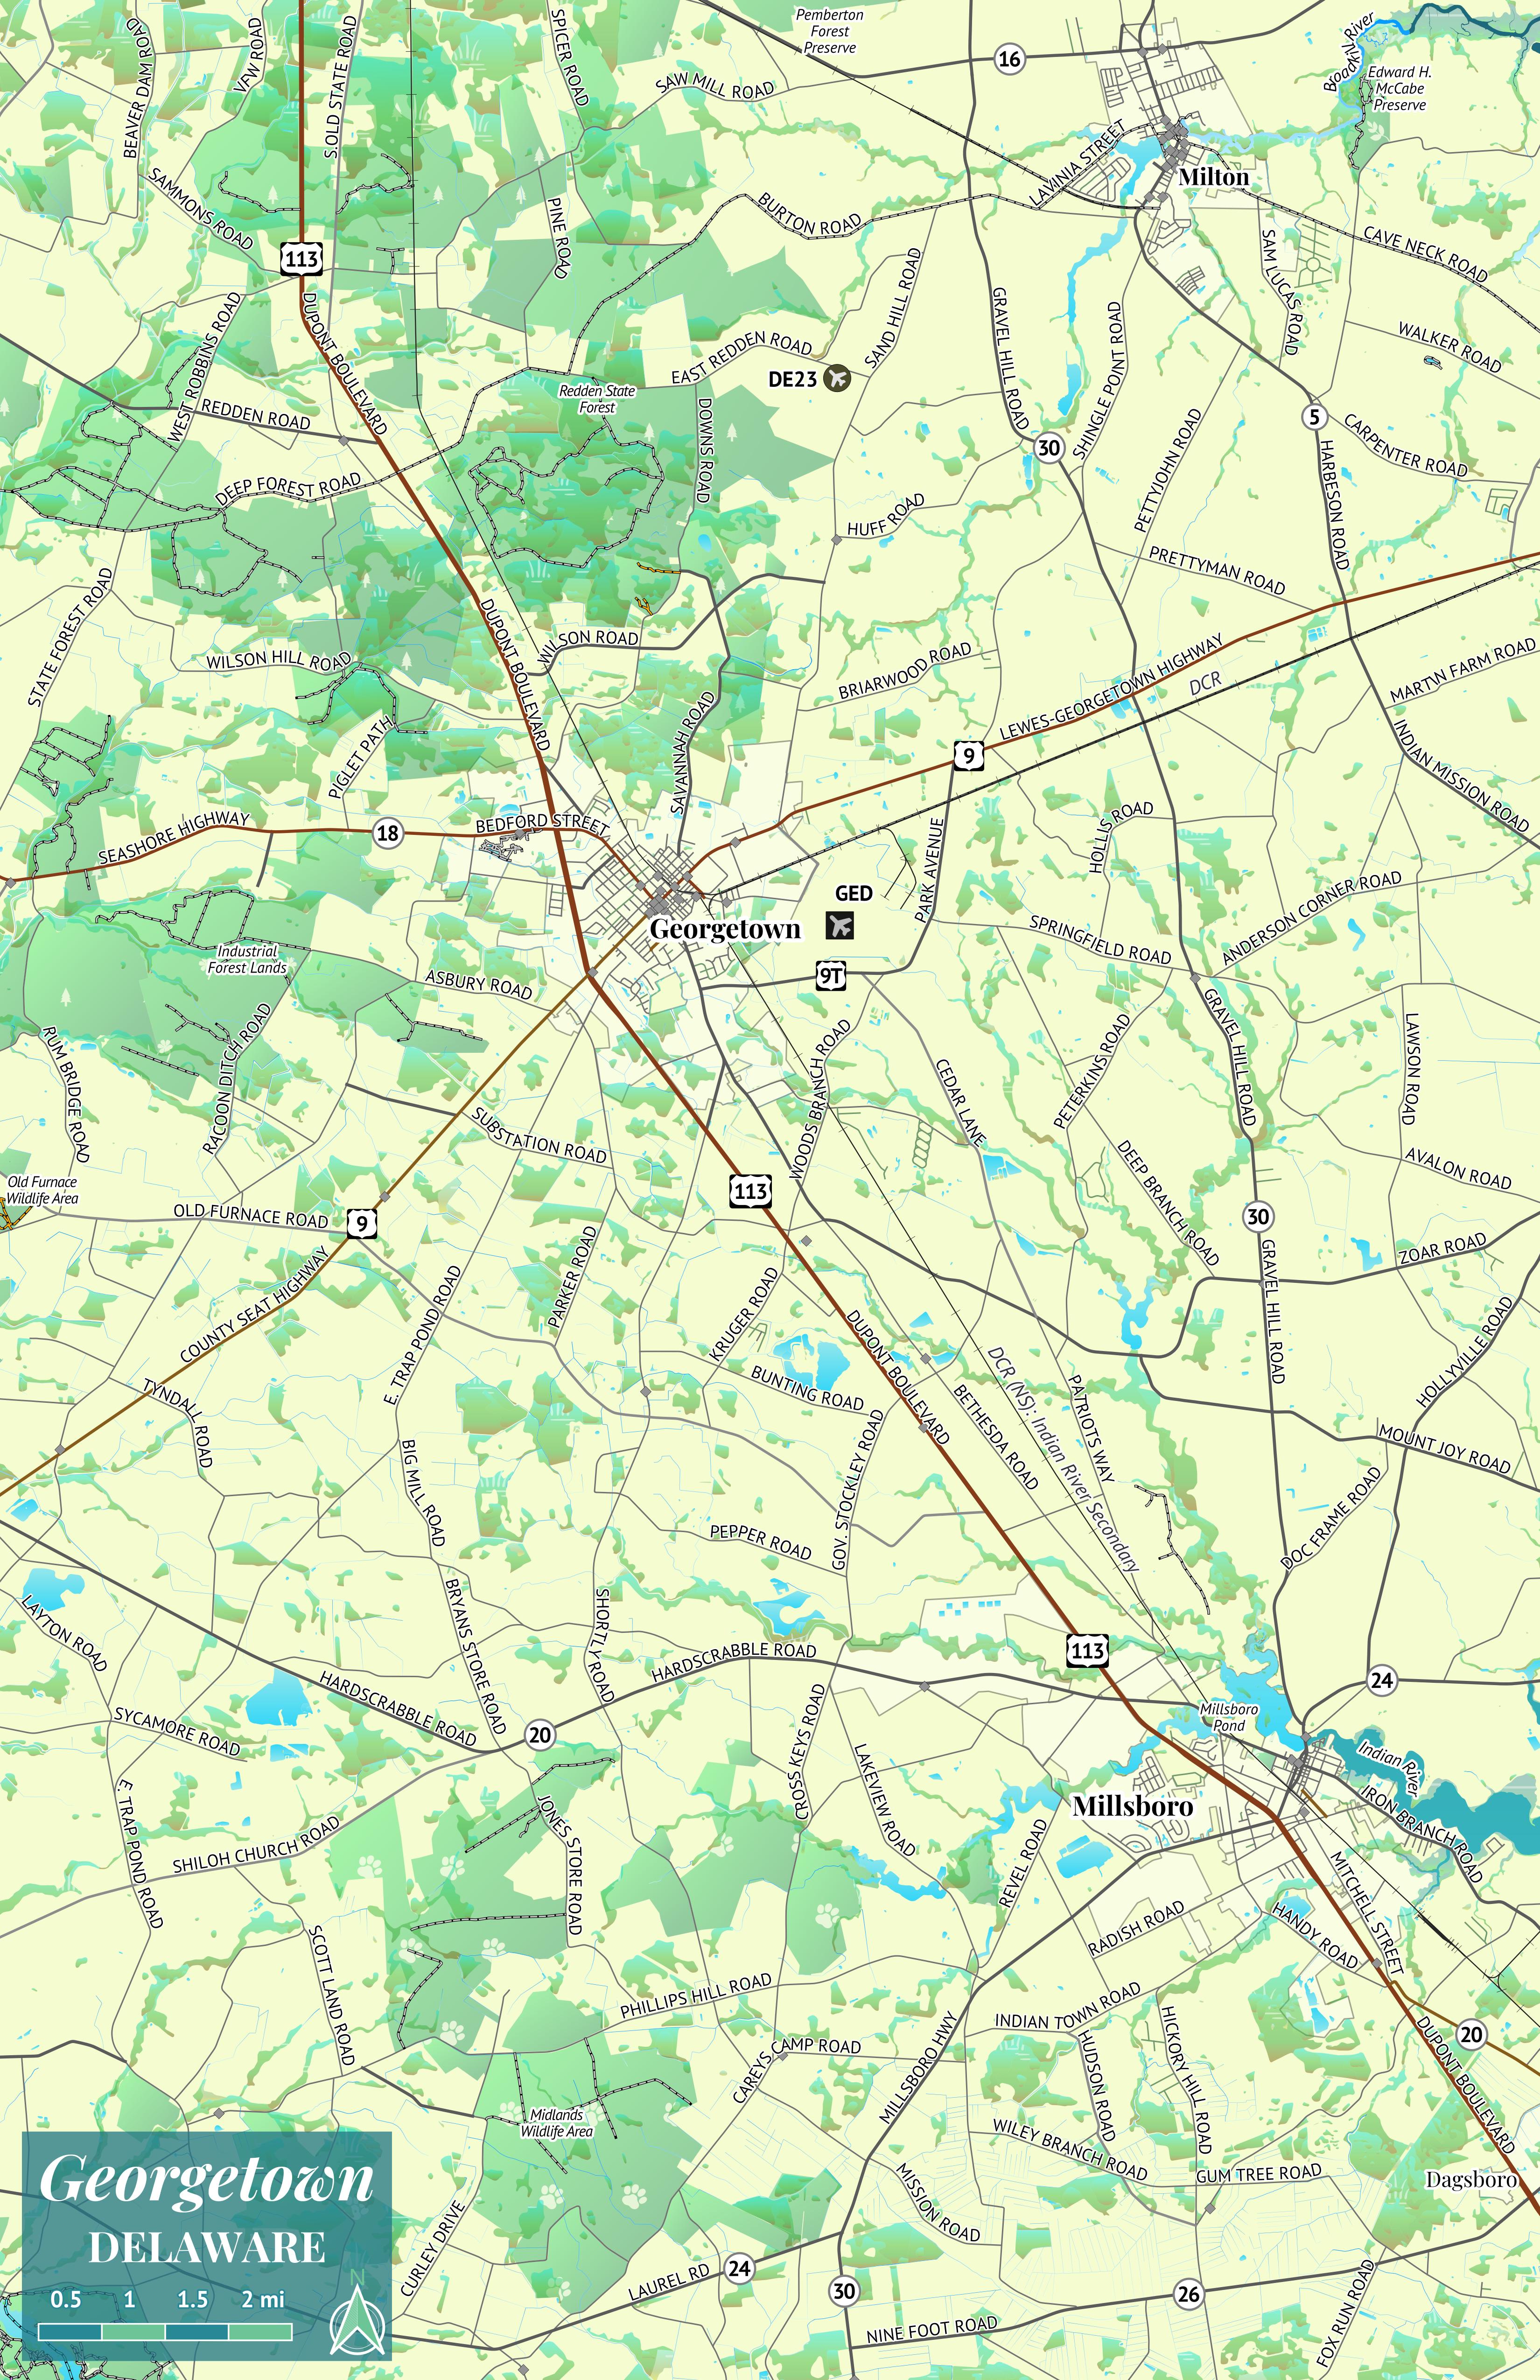
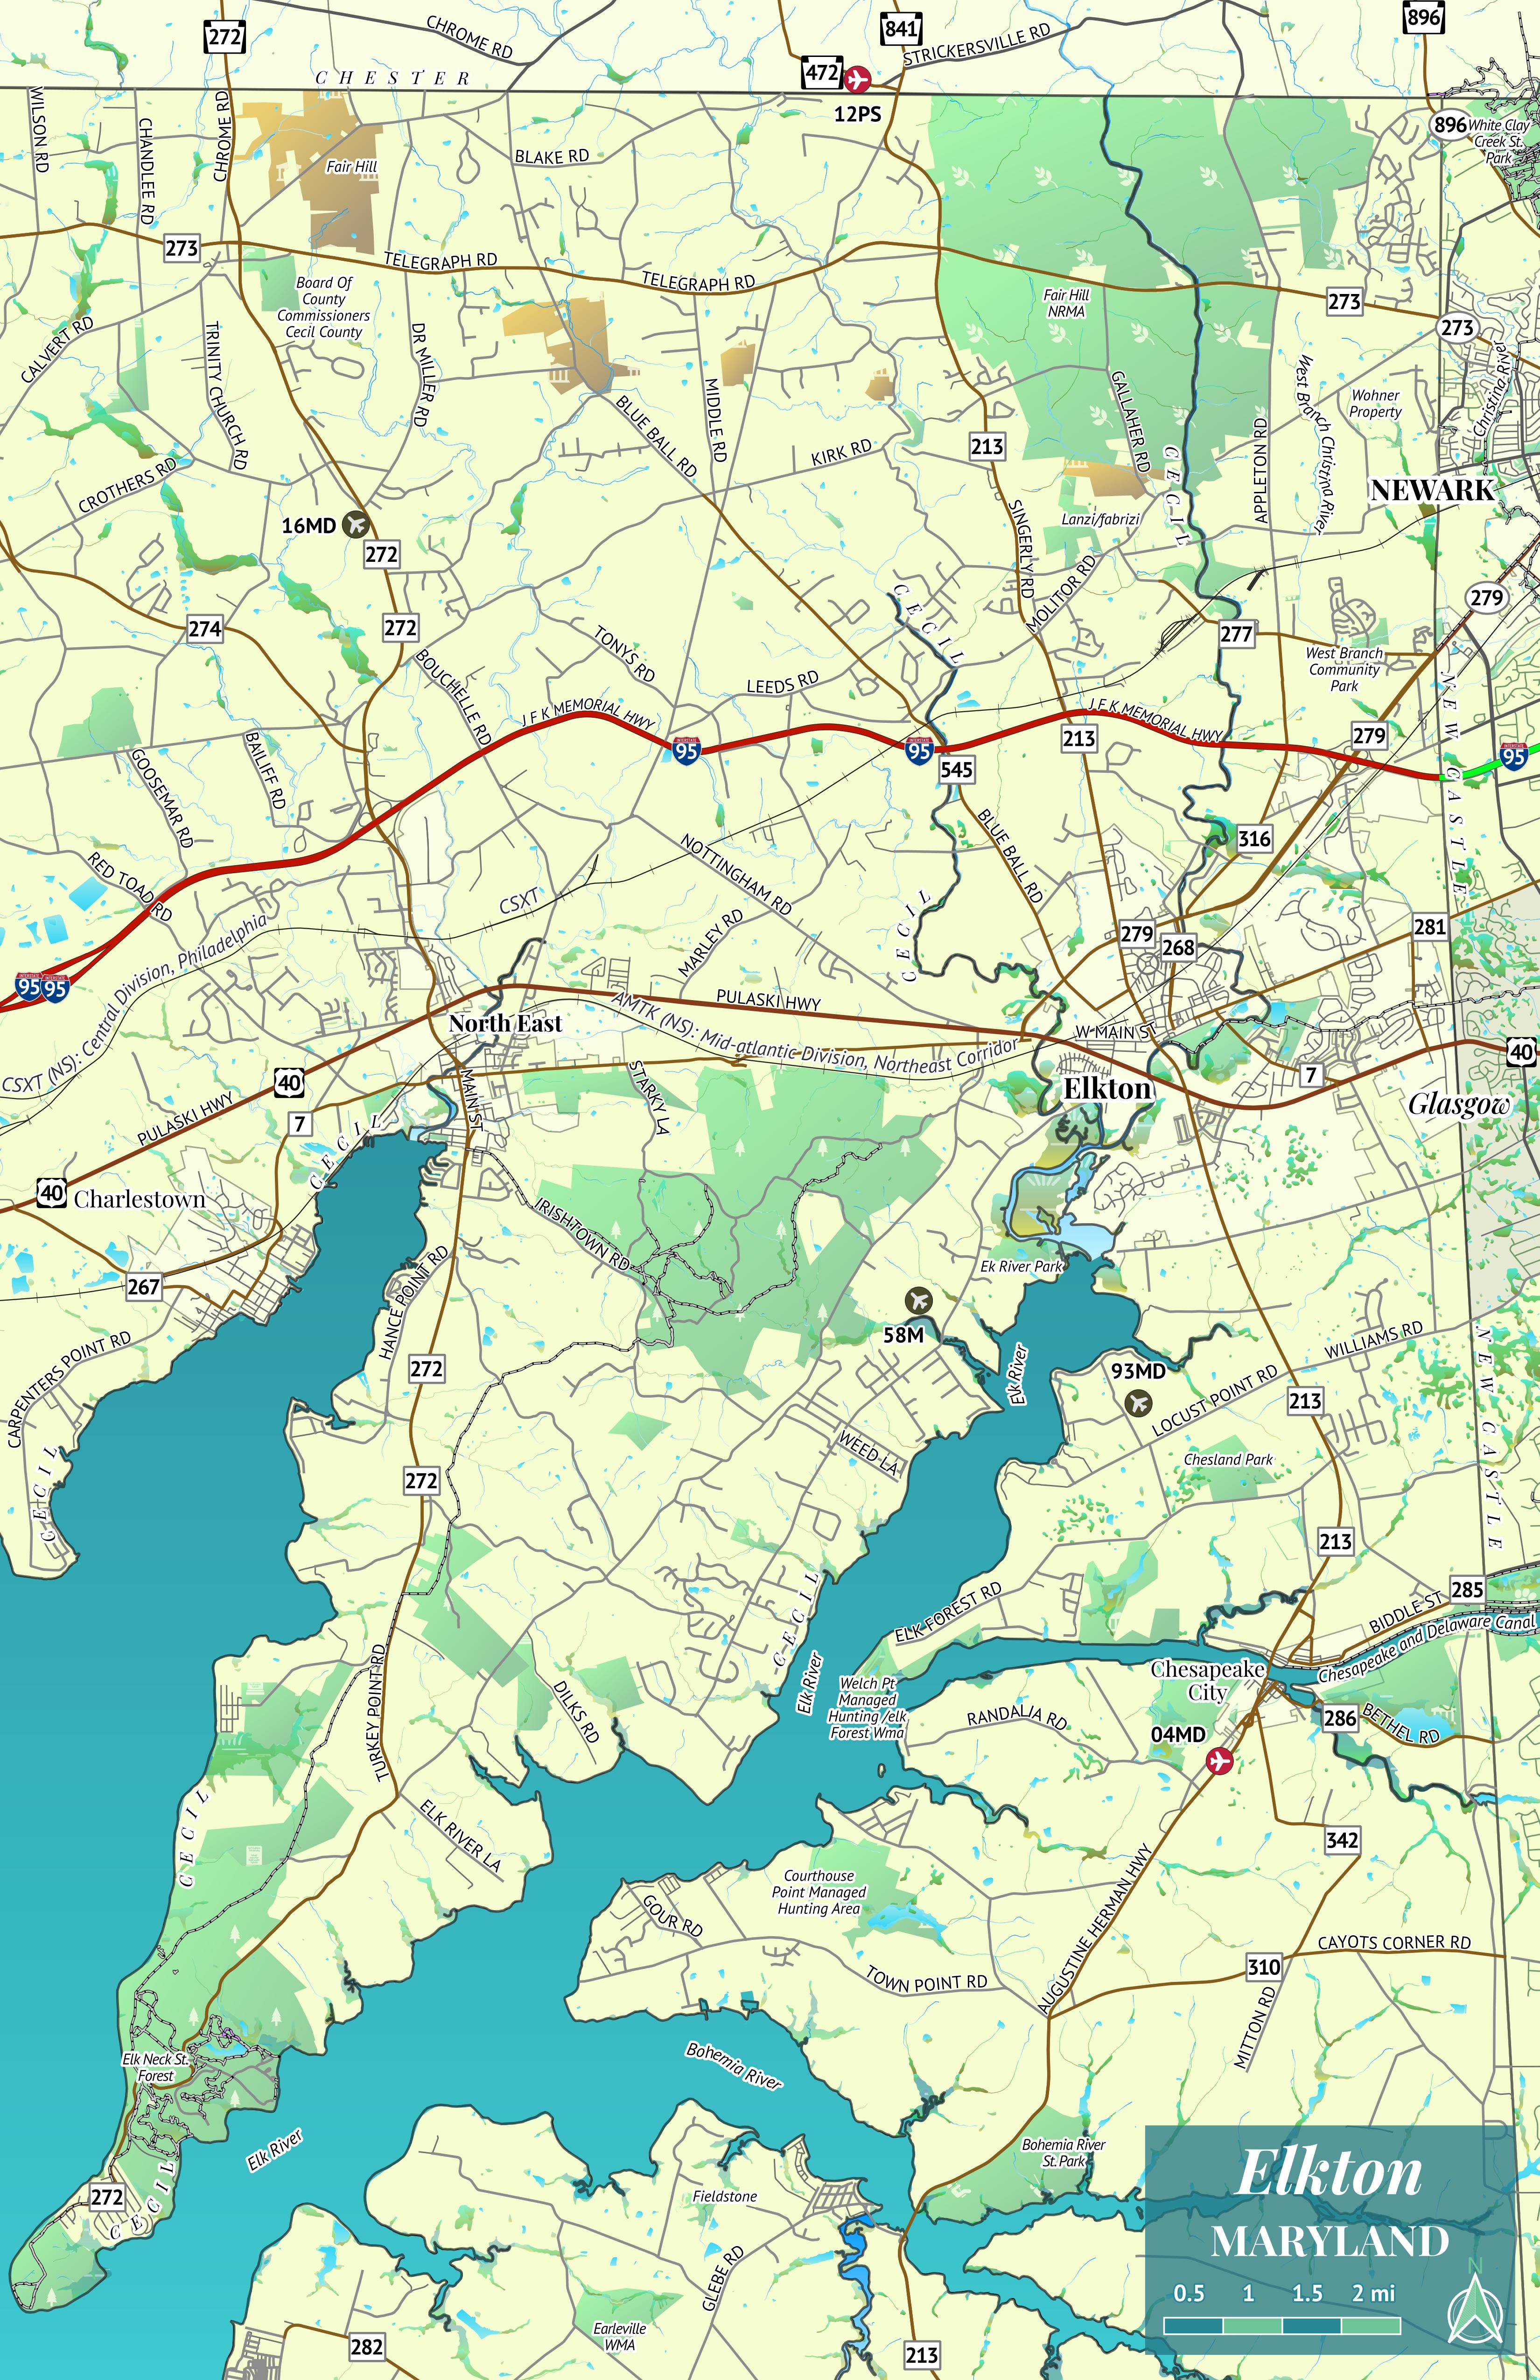
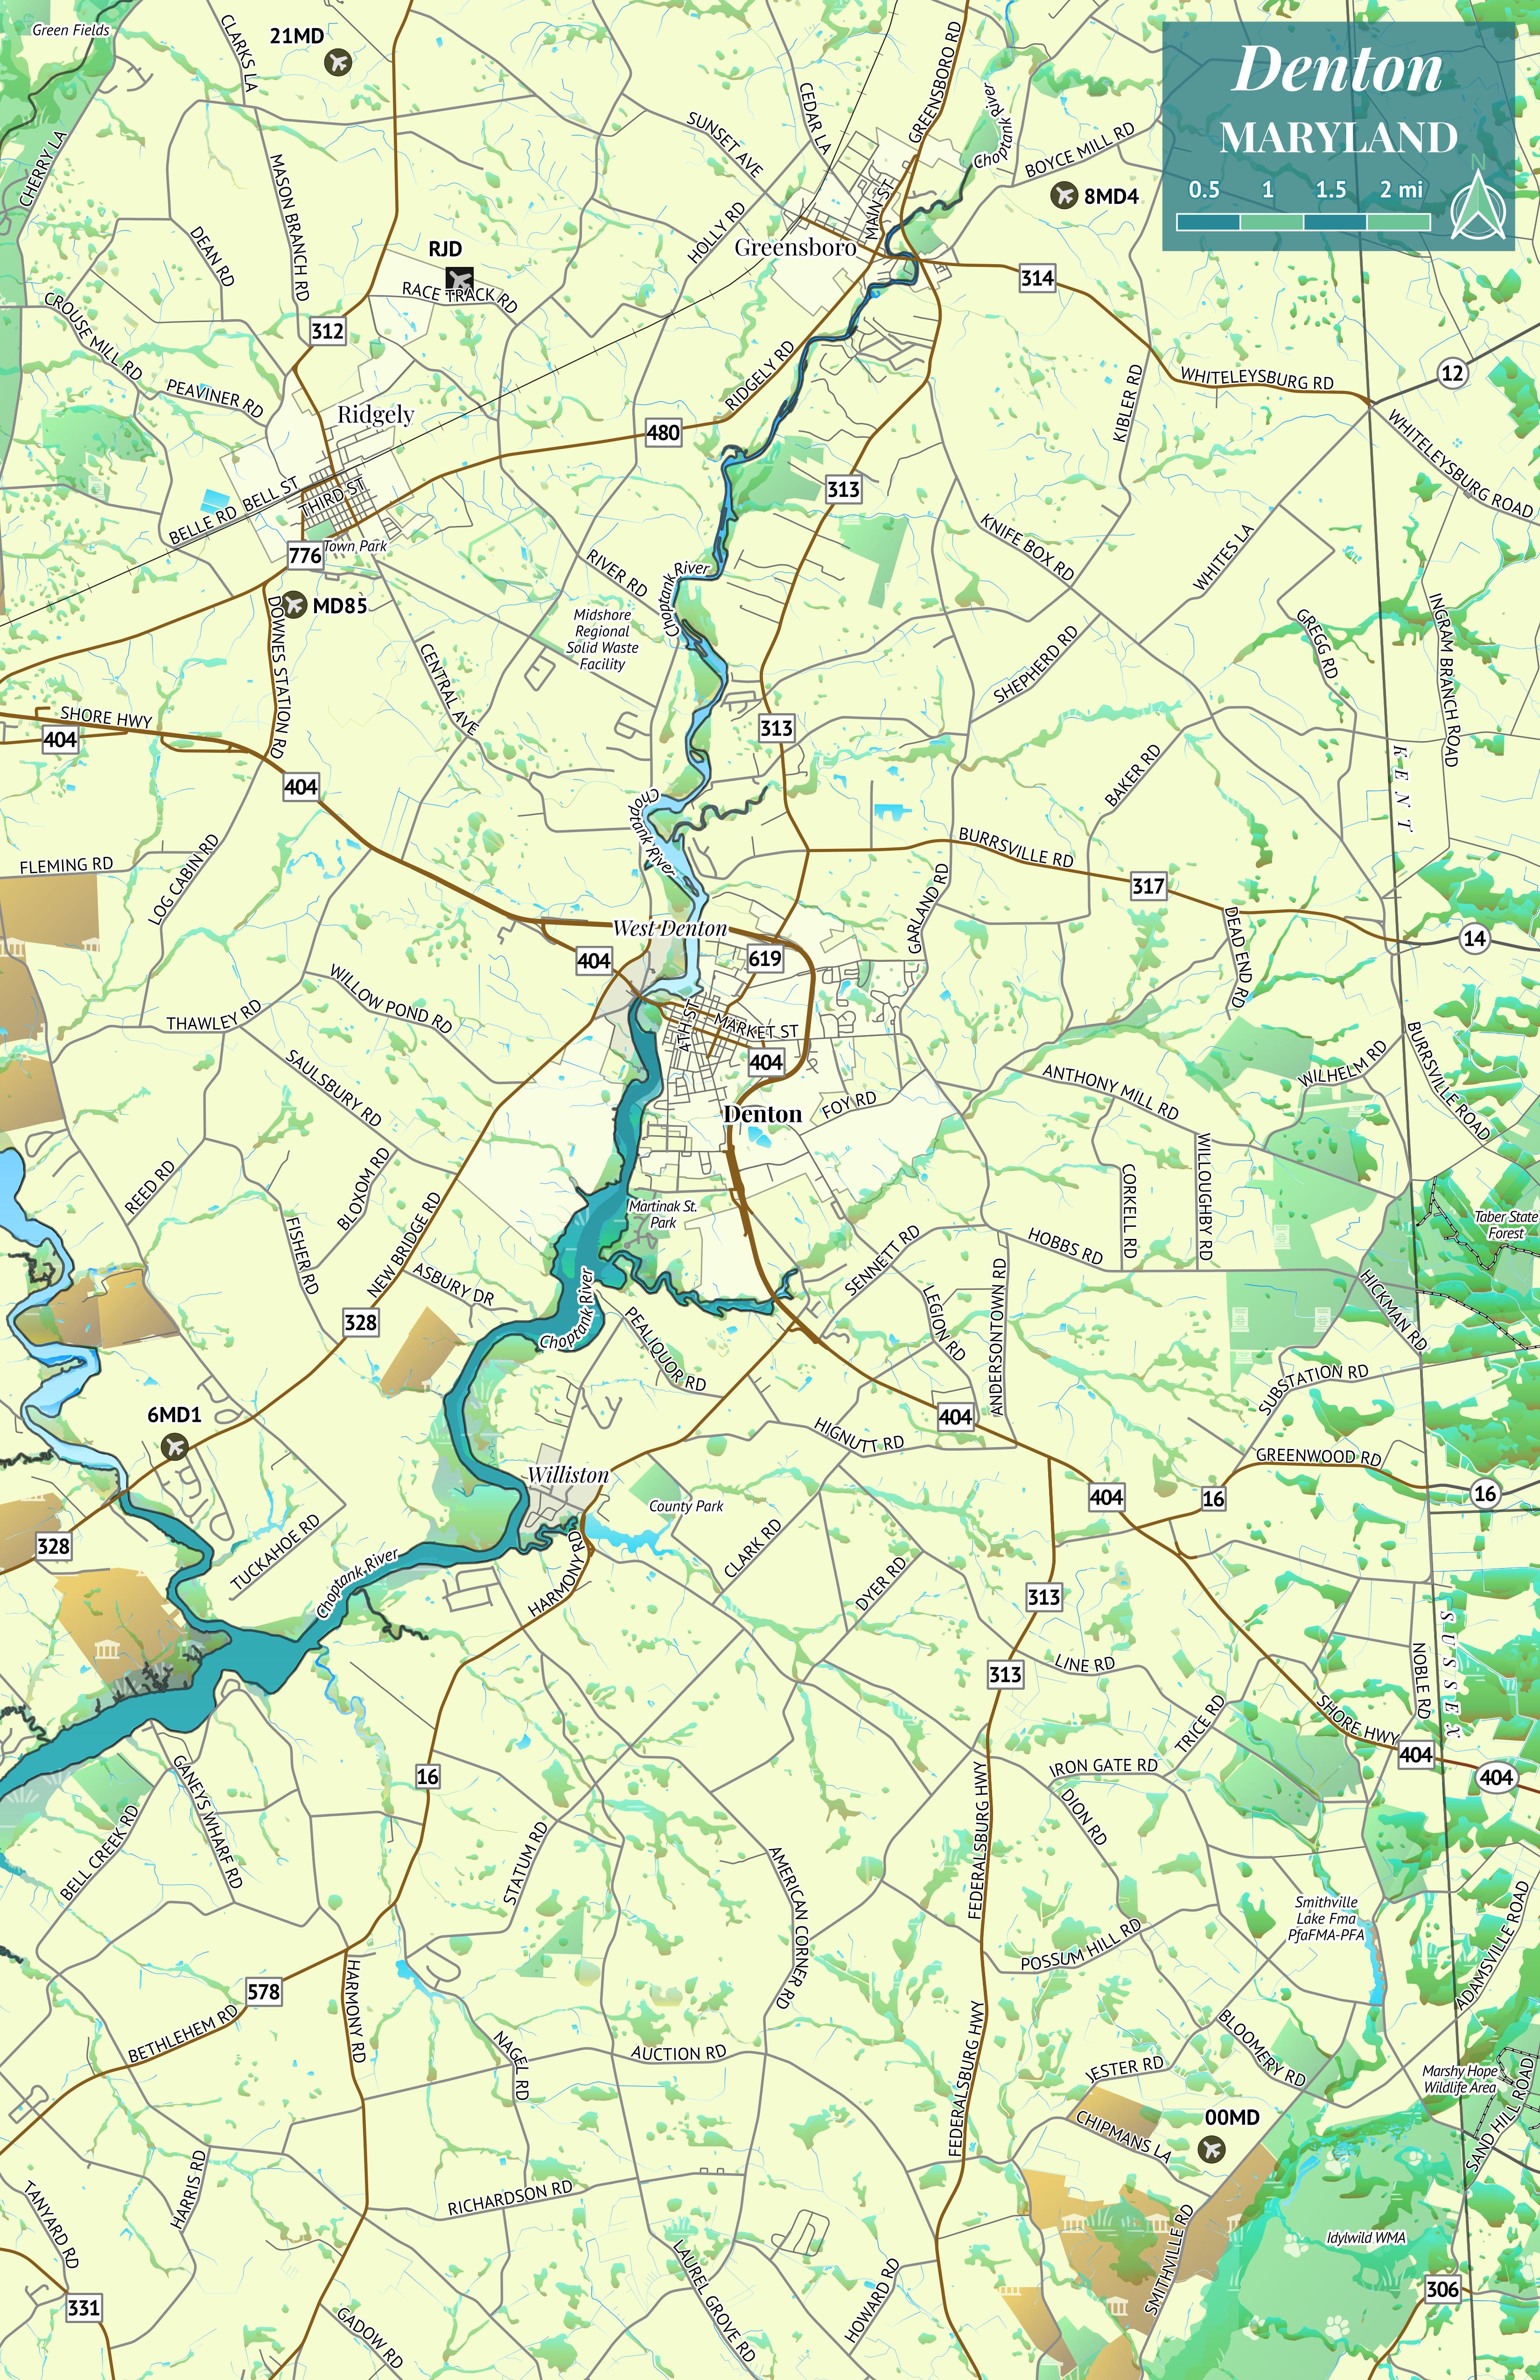
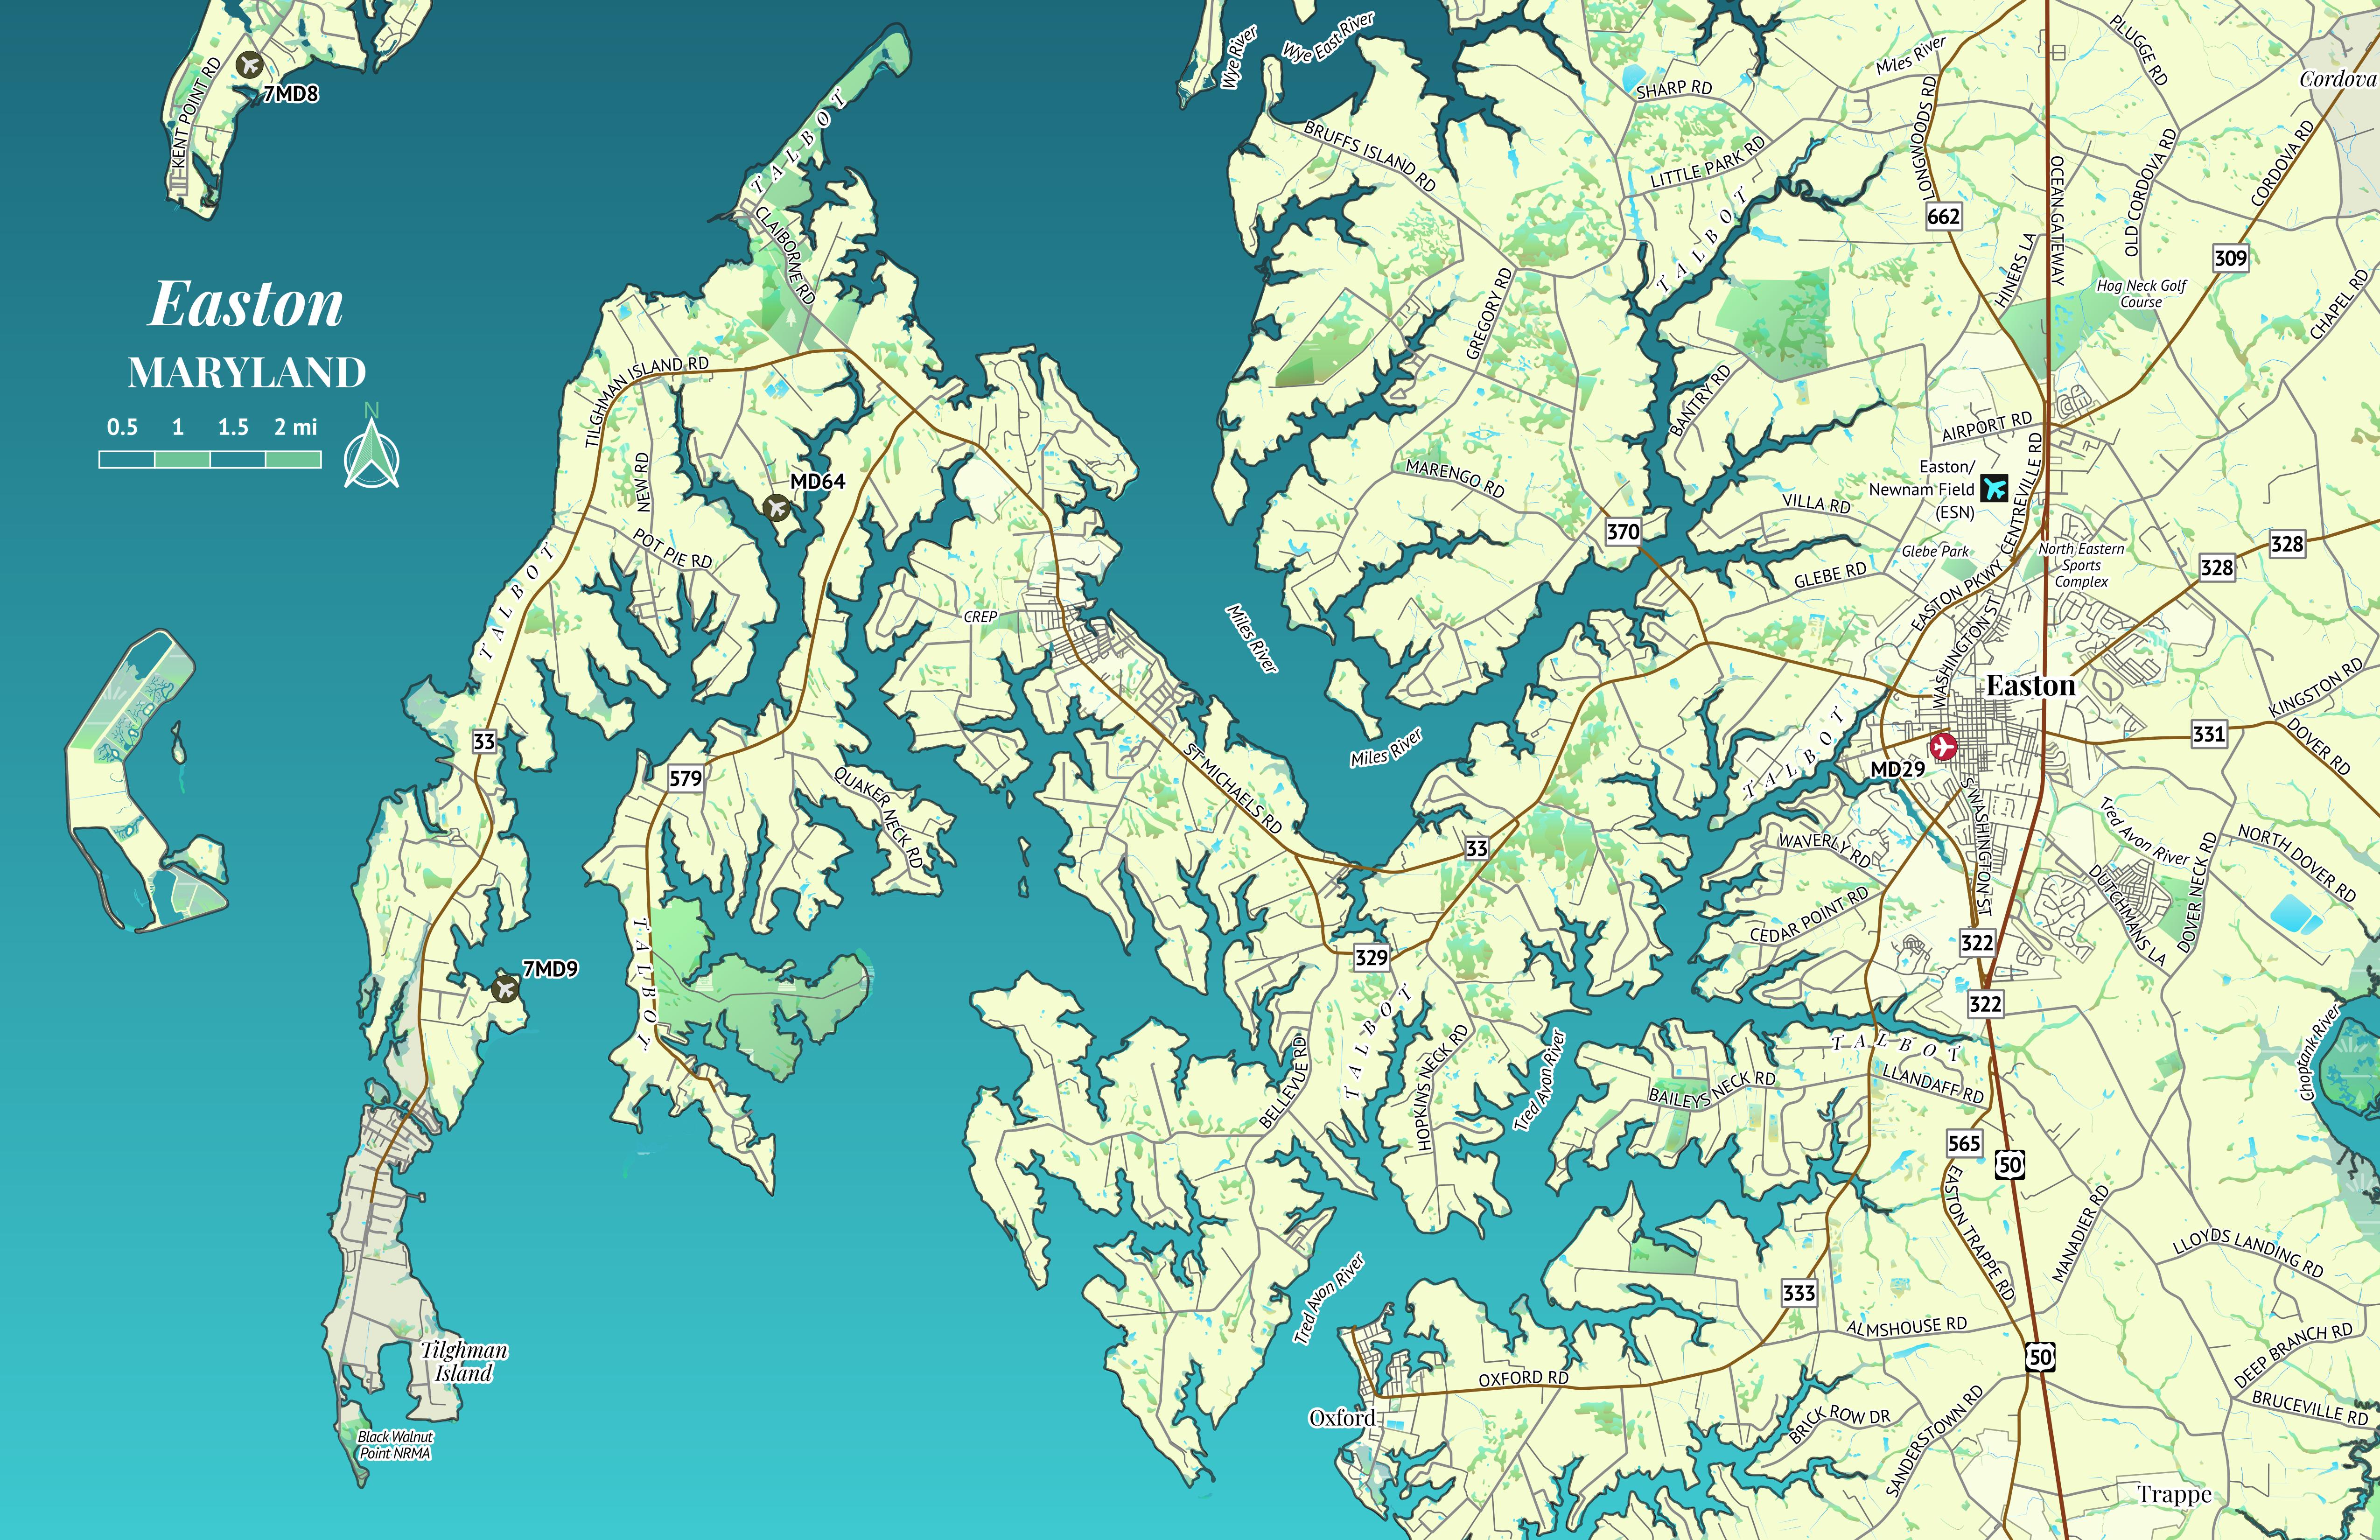
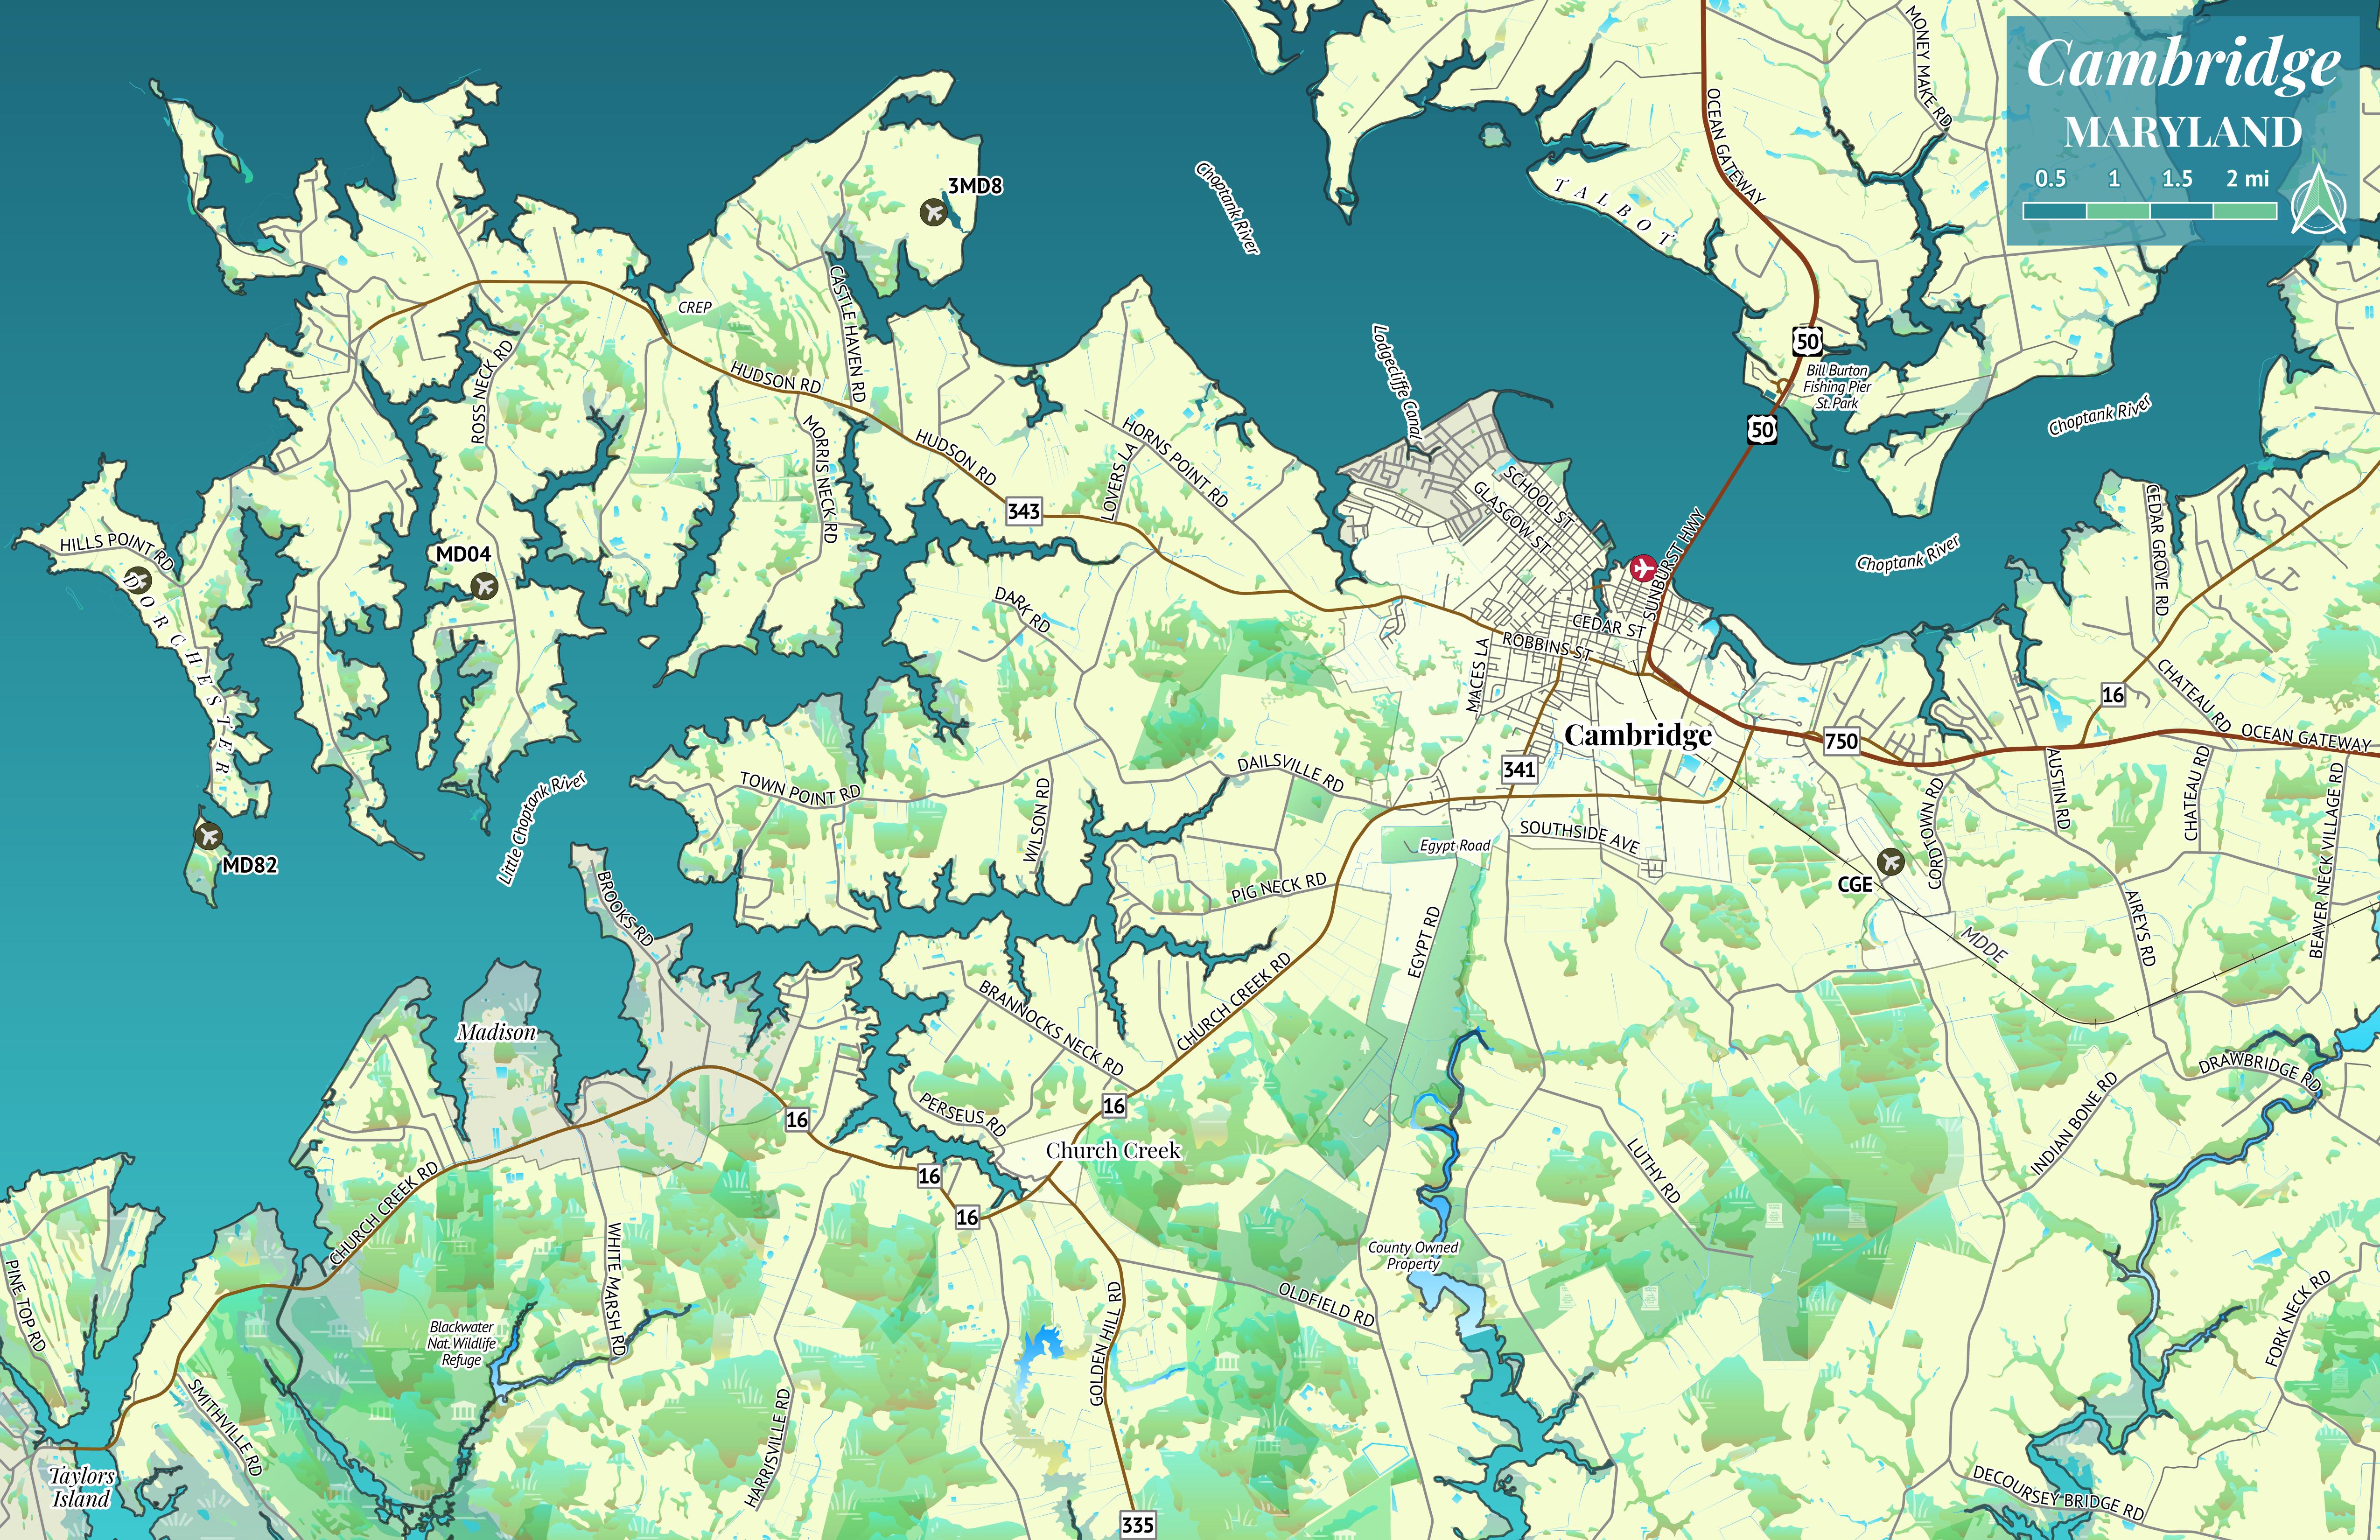
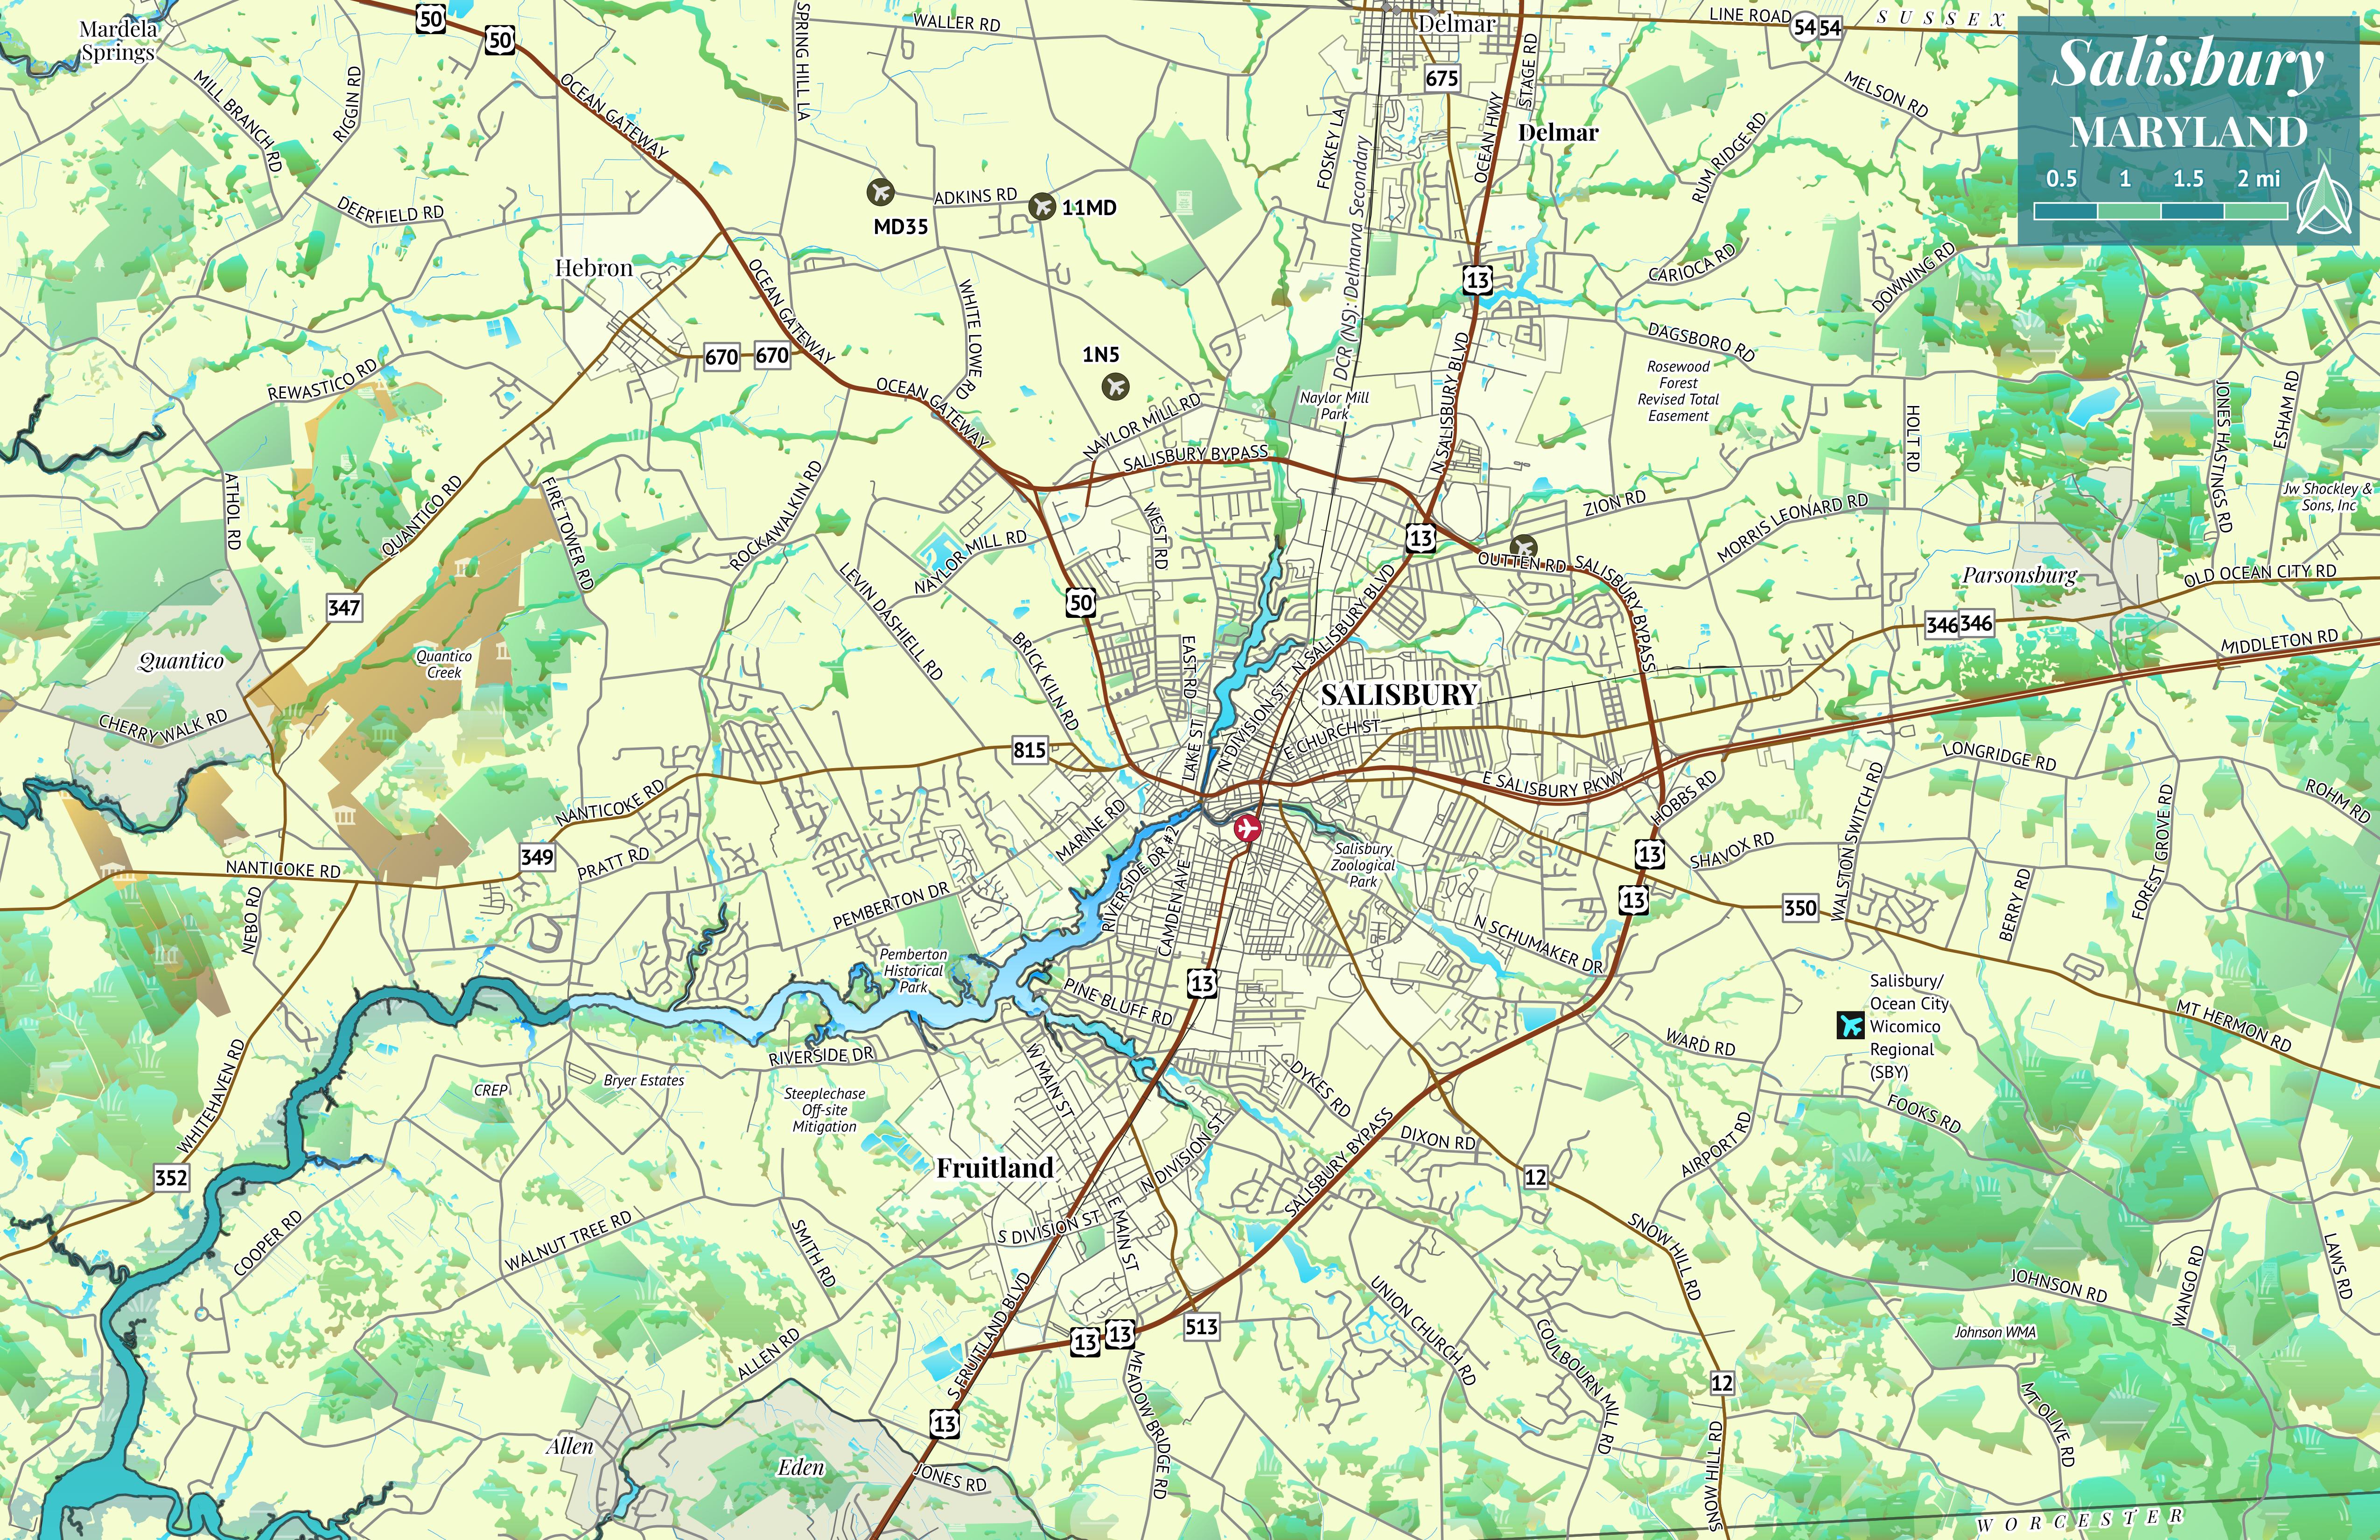
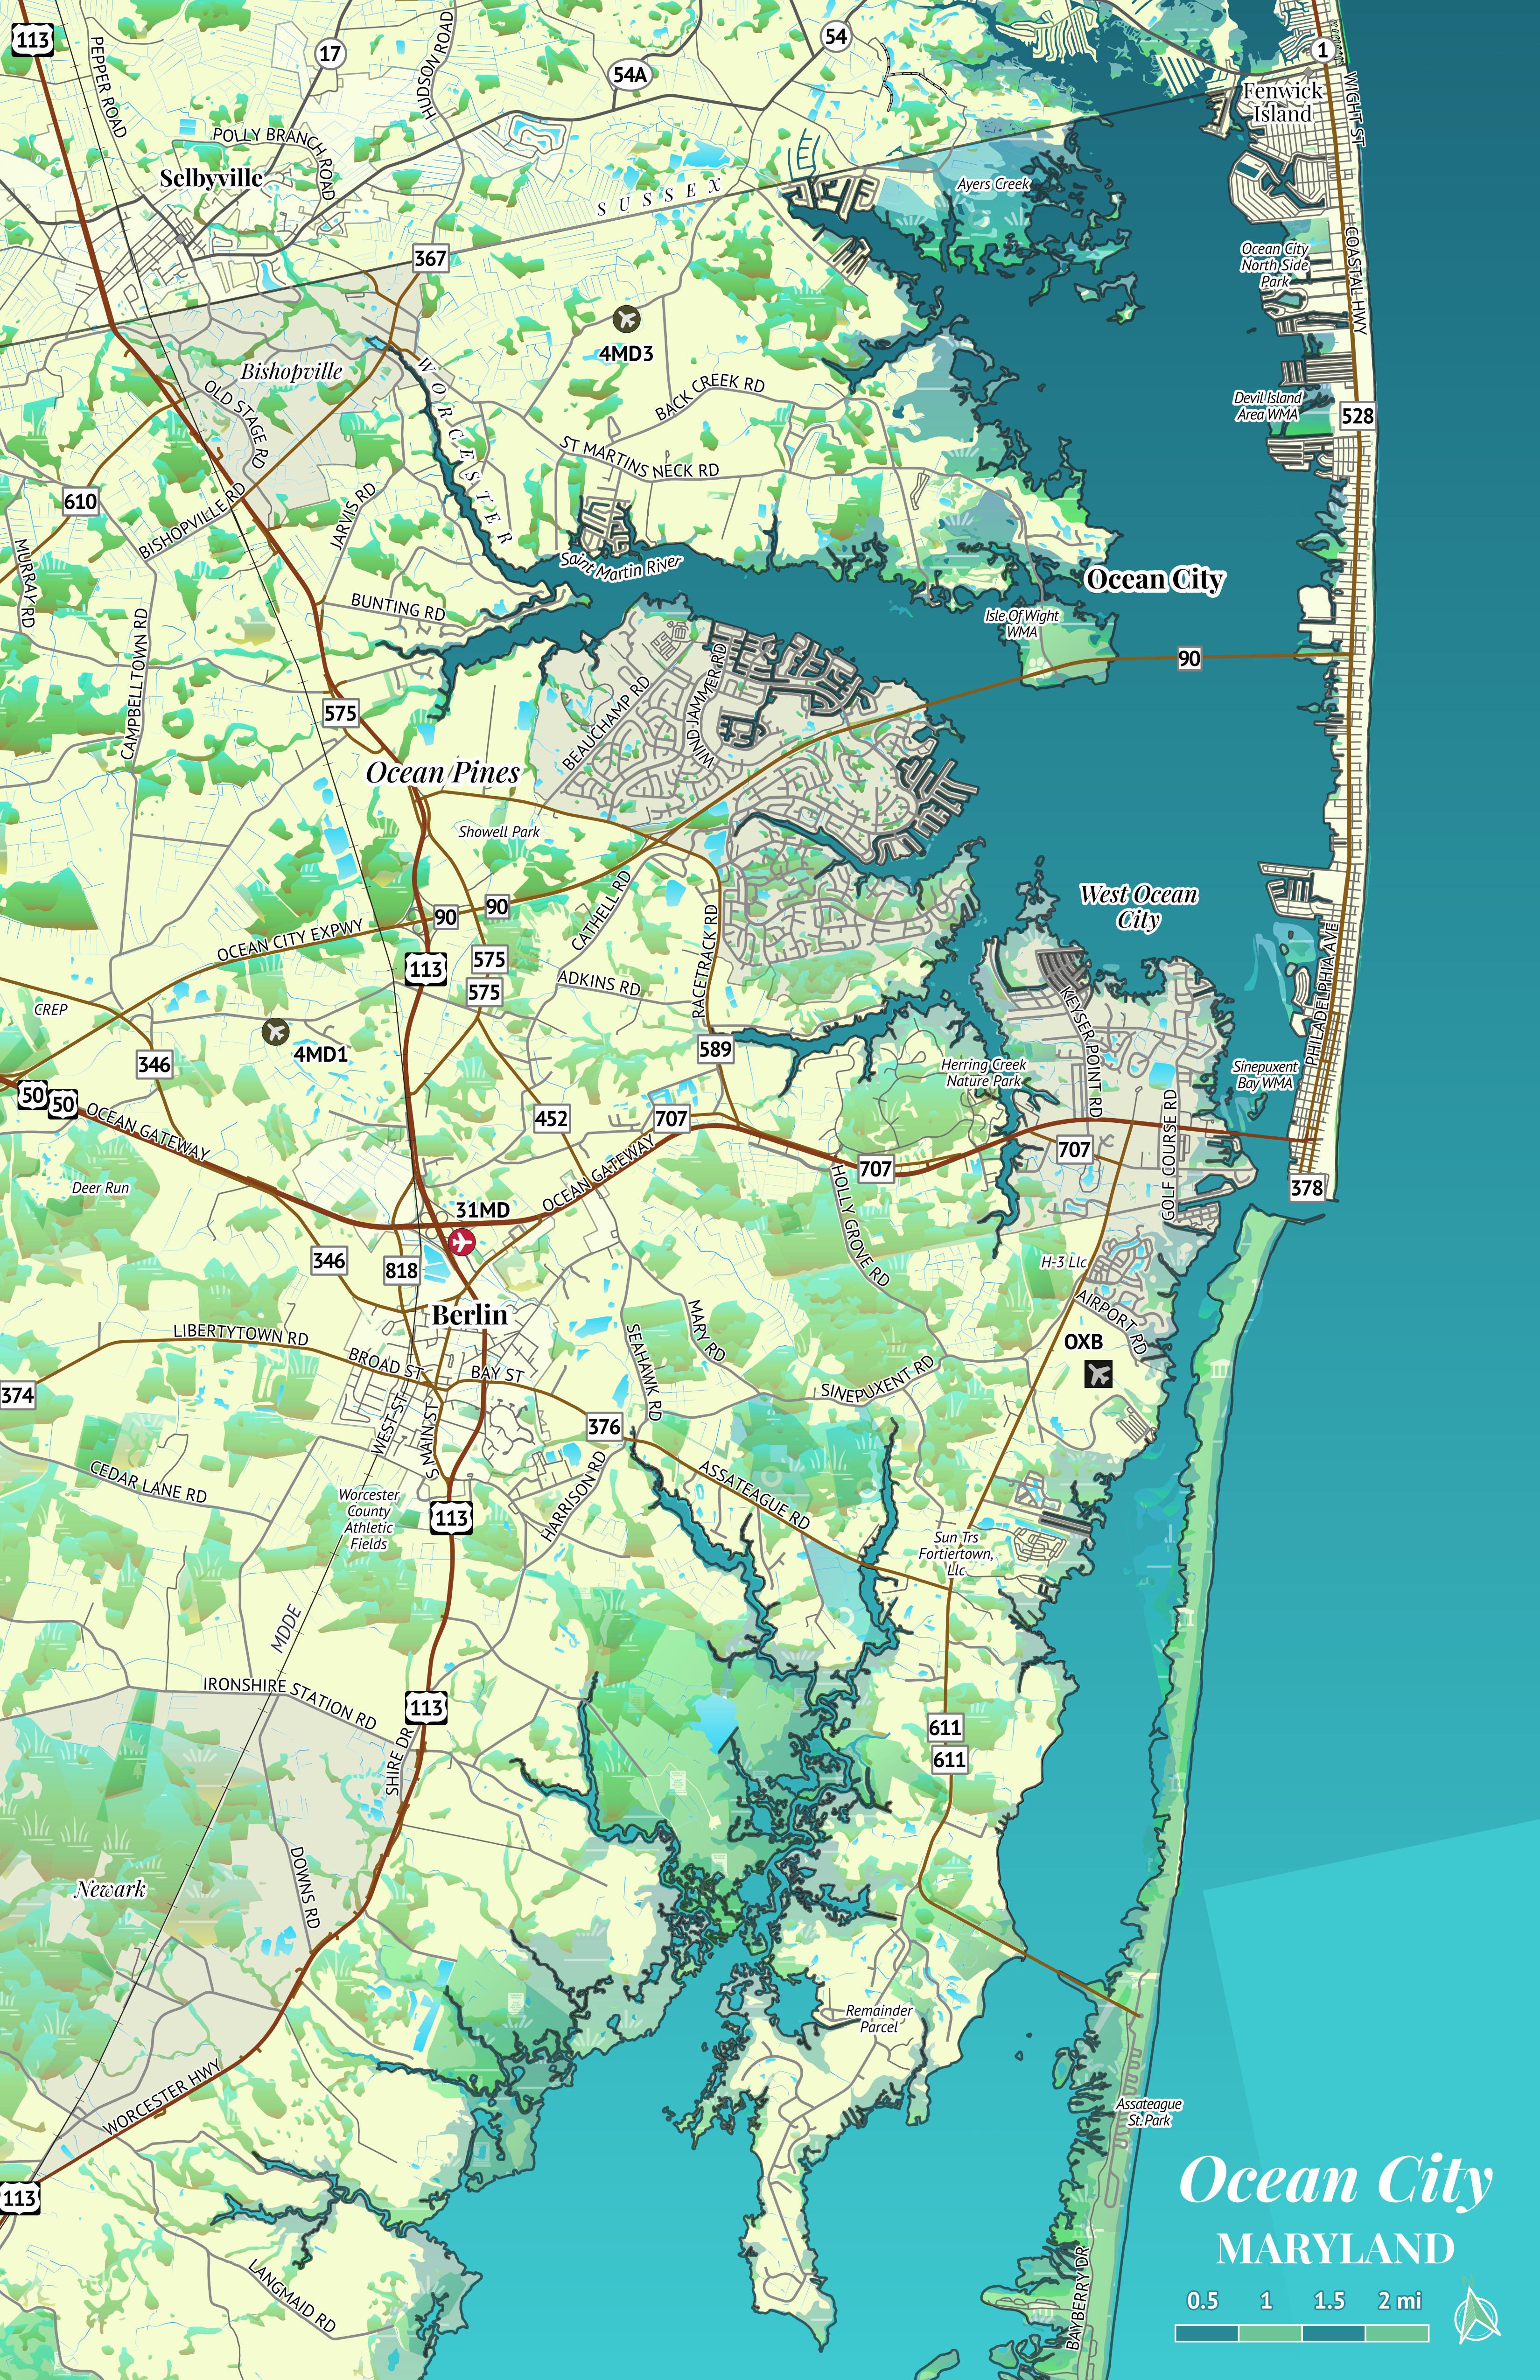
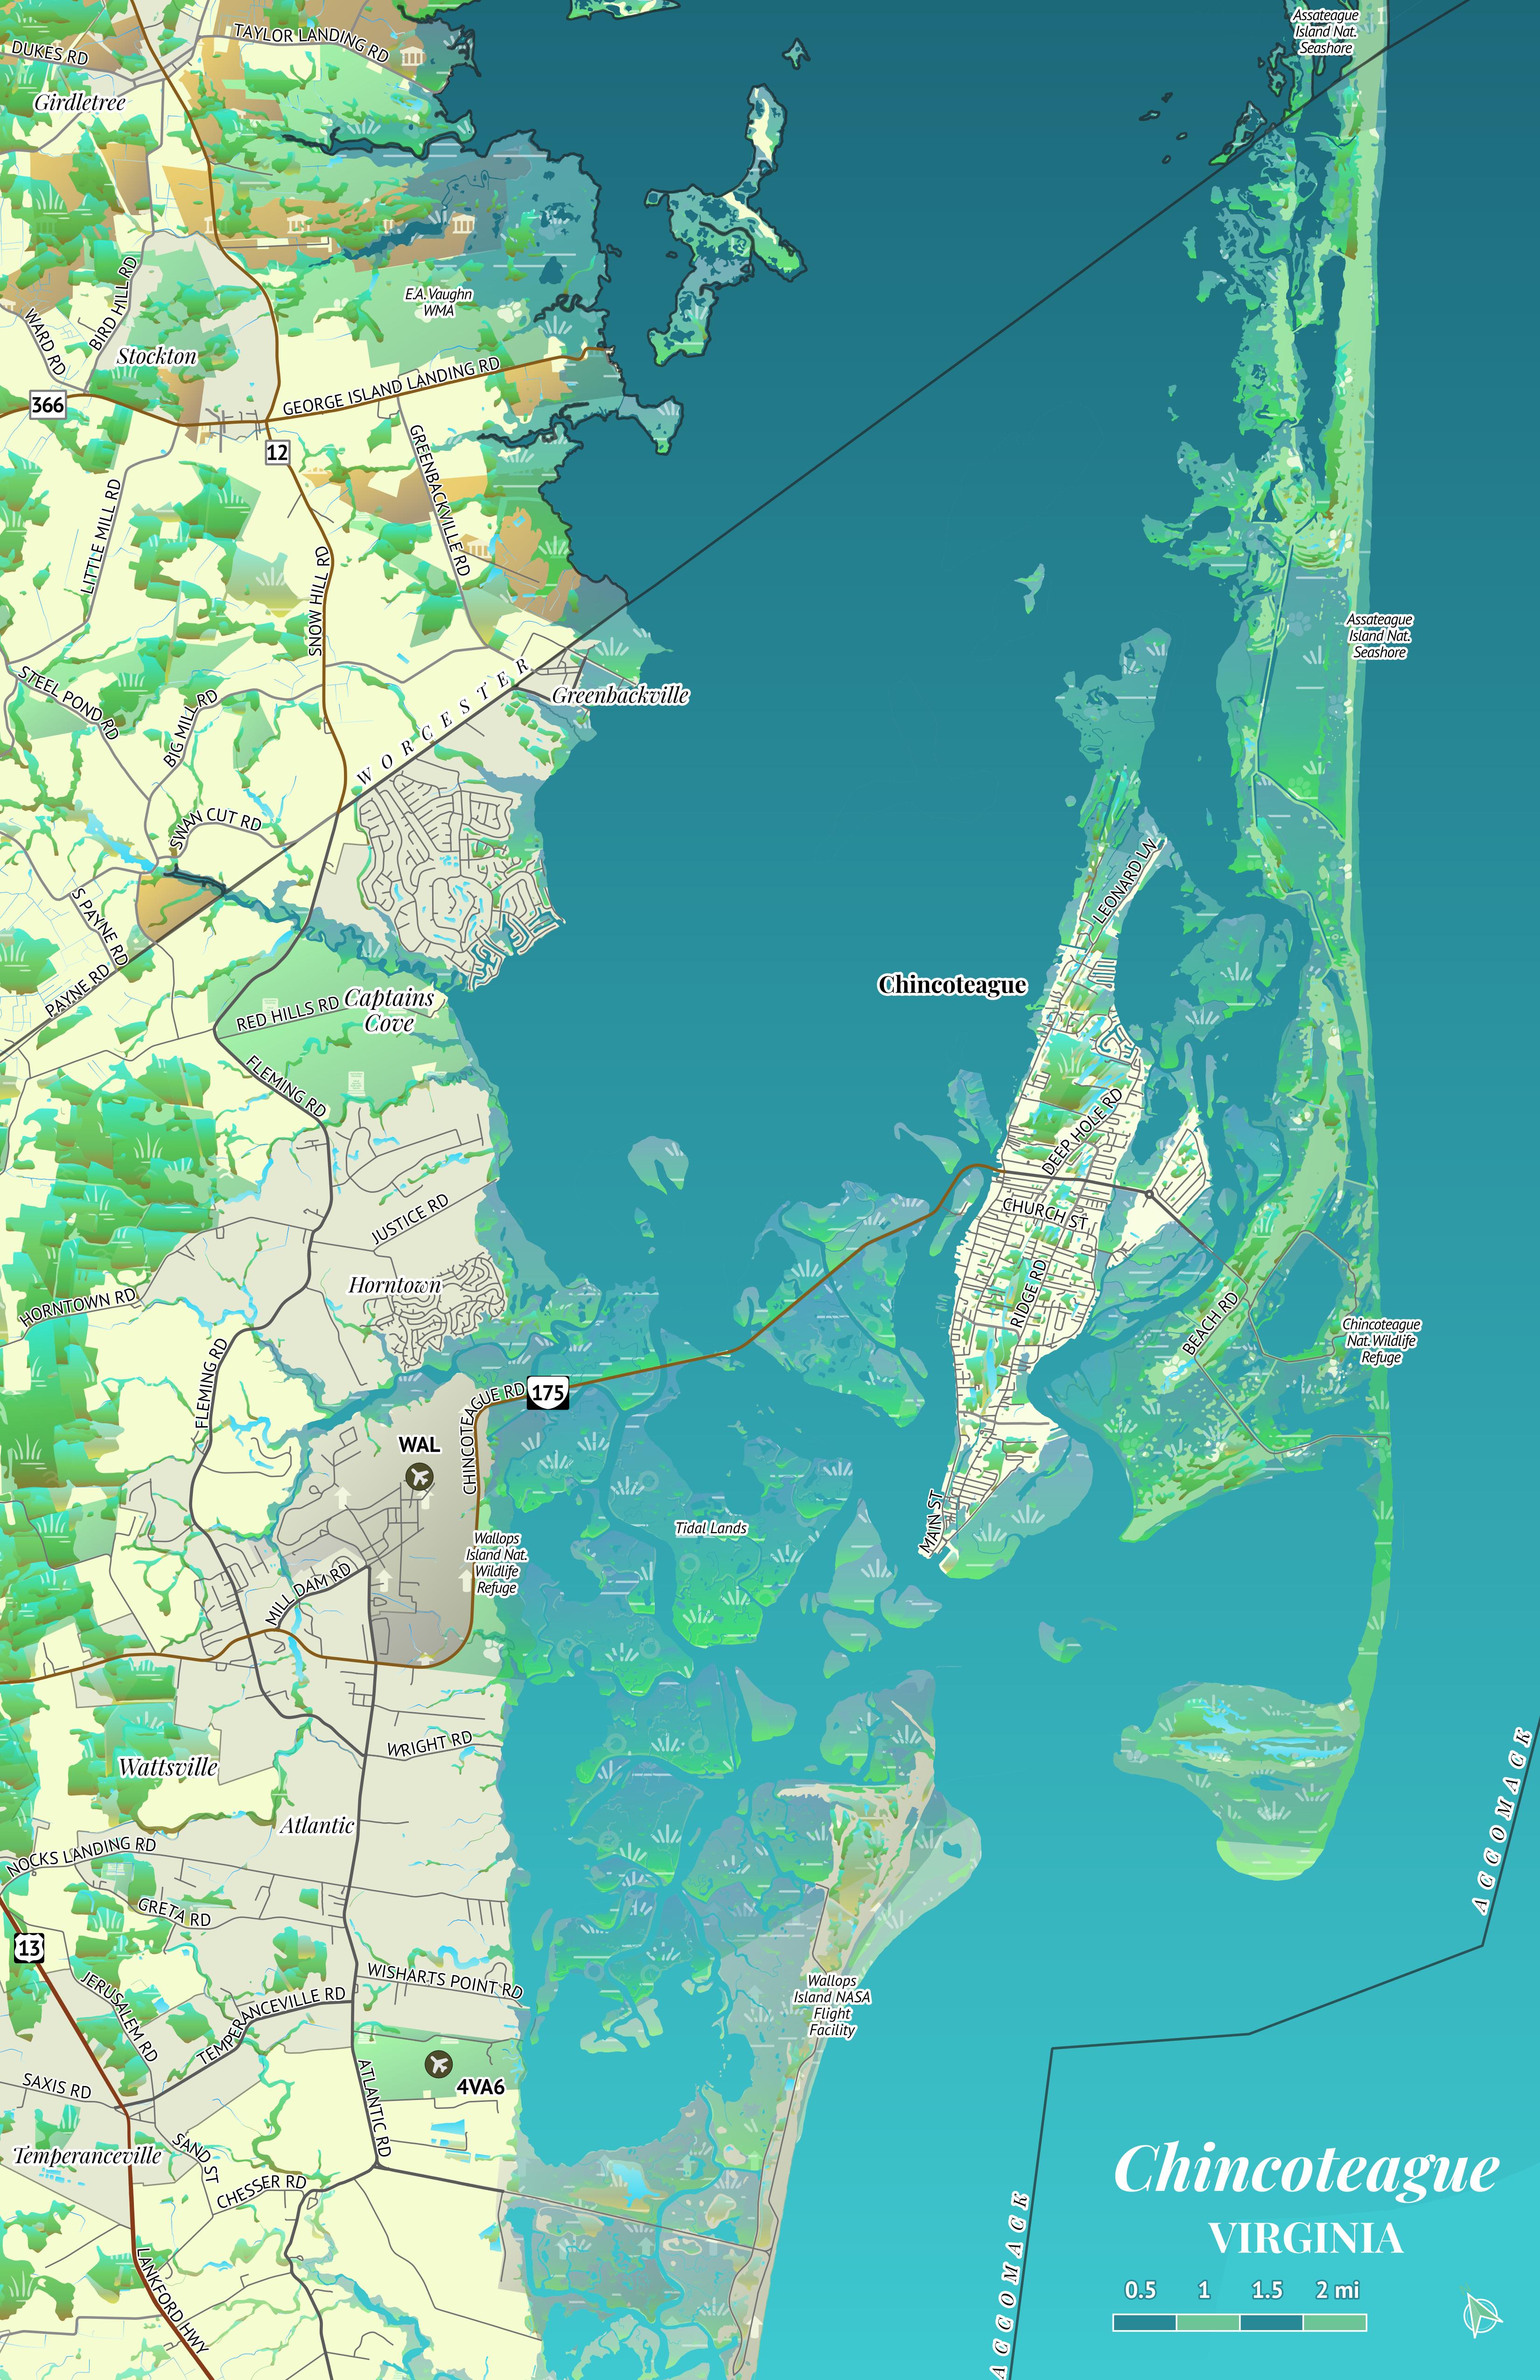
This series of maps covers the Delmarva Peninsula and its unique
geography, as compared to the rest of the northeastern and
mid-Atlantic United States, and is inspired by the idea of elevation
and relief maps. However, because the Delmarva Peninsula is very
flat, elevation and relief maps of the area would not be very
interesting. In examining Delaware's GIS data, specifically, I found
that the wetlands layer could yield a beautiful representation of
the state, so that was used as the basis of these maps.
These maps were made public on the sixth
anniversary of when I moved to Delaware.
Data Sources and Data Management
These maps were developed using GIS data from various sources,
including:
- Federal Government Sources
- Wetlands - United States Fish and Wildlife Service,
National Wetlands Inventory
- Waterway Names - United States Geological Survey,
National Hydrography Dataset
- Railroads and Airports - United States Department of
Transportation, National Transportation Atlas Database
- Census Designated Places (DE, MD, VA only) - United
States Census Bureau, 2020 TIGER/Line Shapefiles
- State Government Sources
- Railroad Stations - DE, MD, VA, and NJ Departments
of Transportation, plus Penn State University (for PA)
- Roadways - DE, MD, VA, NJ, and PA Departments of
Transportation
- Counties and Municipalities - DE, MD, VA, and NJ
statewide GIS databases, plus Penn State University (for PA)
- Public/Protected Lands (DE, MD, VA only) - DE
Department of Natural Resources and Environmental Control, MD
Department of Natural Resources, and VA Department of
Conservation and Recreation
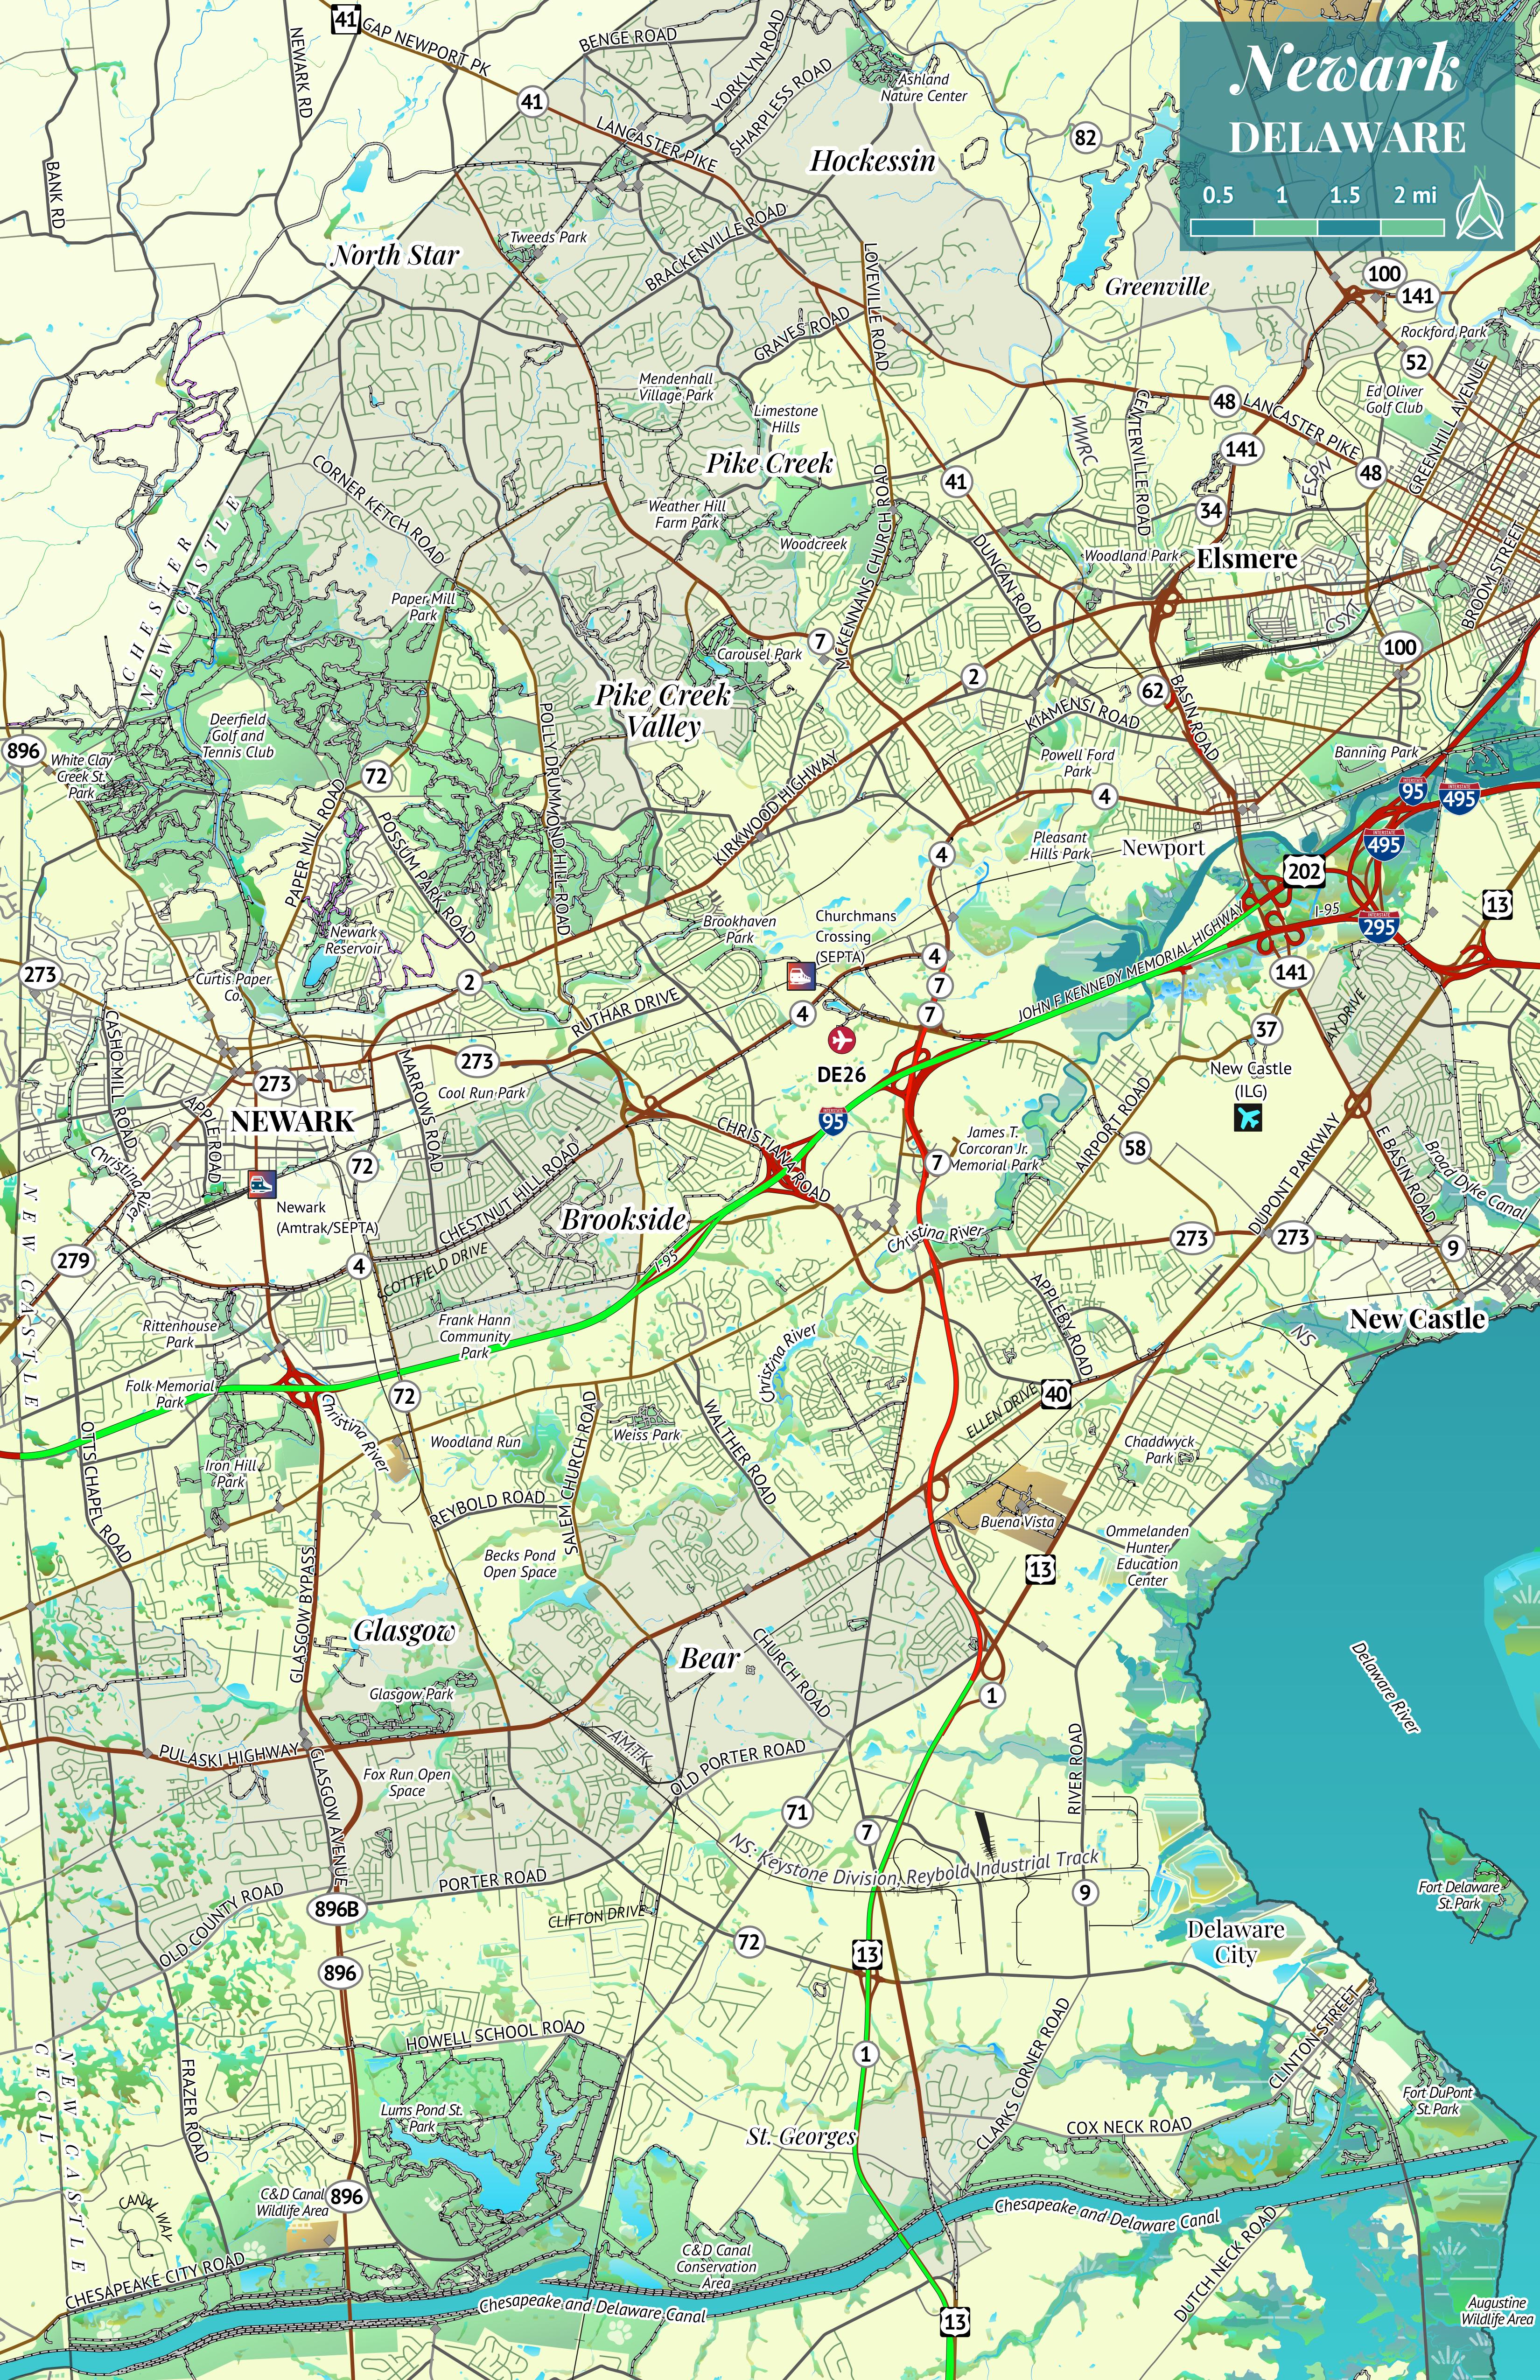
- Trails and Pathways (DE only) - DE Department of
Natural Resources and Environmental Control and DE Department
of Transportation
- Historic Markers (DE only) - DE Department of State
The datasets required numerous adjustments to ensure consistency
in data representation, as each state had slightly different
schemas (data layouts). Additionally, rendering datasets from five
separate states, for each state-derived collection, required
considerable processing power. Thus, the state-derived datasets
were combined into one for each type (e.g., roadways,
municipalities), keeping the data necessary for representation in
the map (e.g., municipalities would require the name, state, and
population, as population determined the formatting of the label).
The Waterway Names dataset had its geometry "simplified"
with a tolerance of 10 meters, to reduce the necessary computing
power to render it. All large datasets were clipped to an area
deemed appropriate, bounded approximately as follows: Harrisburg
PA in the northwest, Asbury Park NJ in the northeast, Kitty Hawk
NC in the southeast, and Rocky Mount NC in the southwest.
I am aware that there could be some improvements made to the data
representation on these maps. I'm particularly concerned with the
representation of bannered routes (e.g., US-13 Alternate, MD-404
Business), as each state has a slightly different way of handling
these types of routes. This leads to inconsistencies in
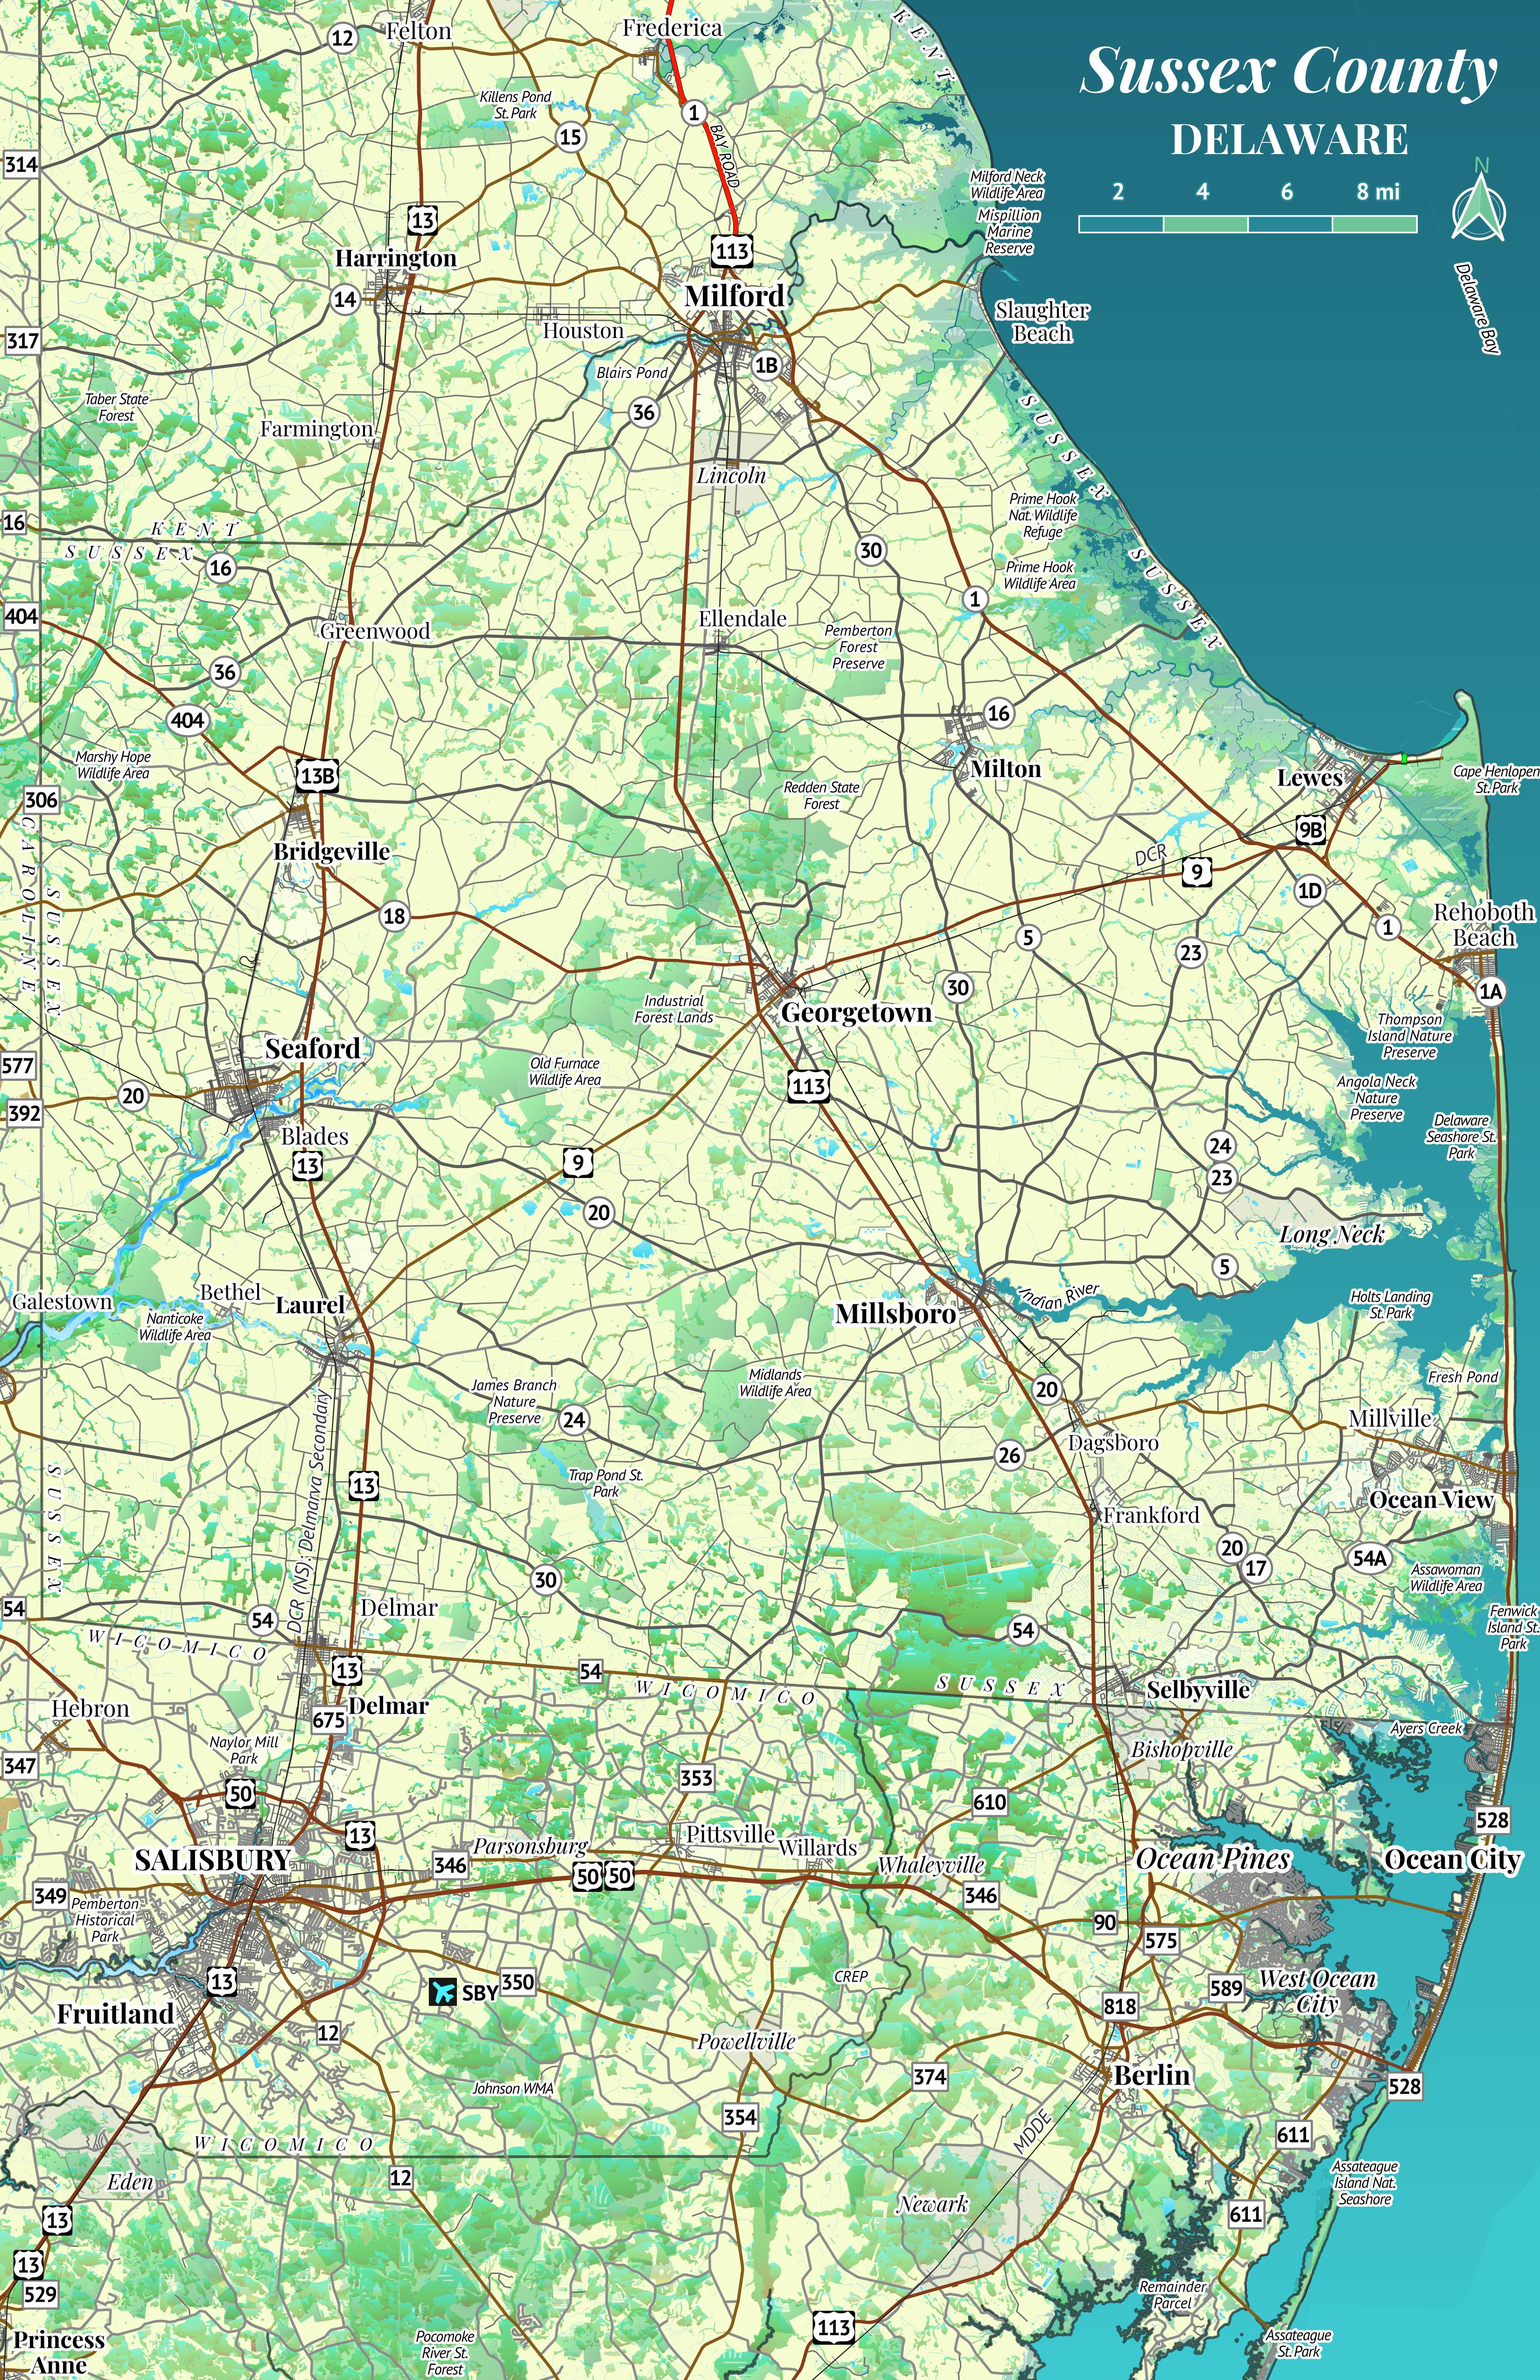
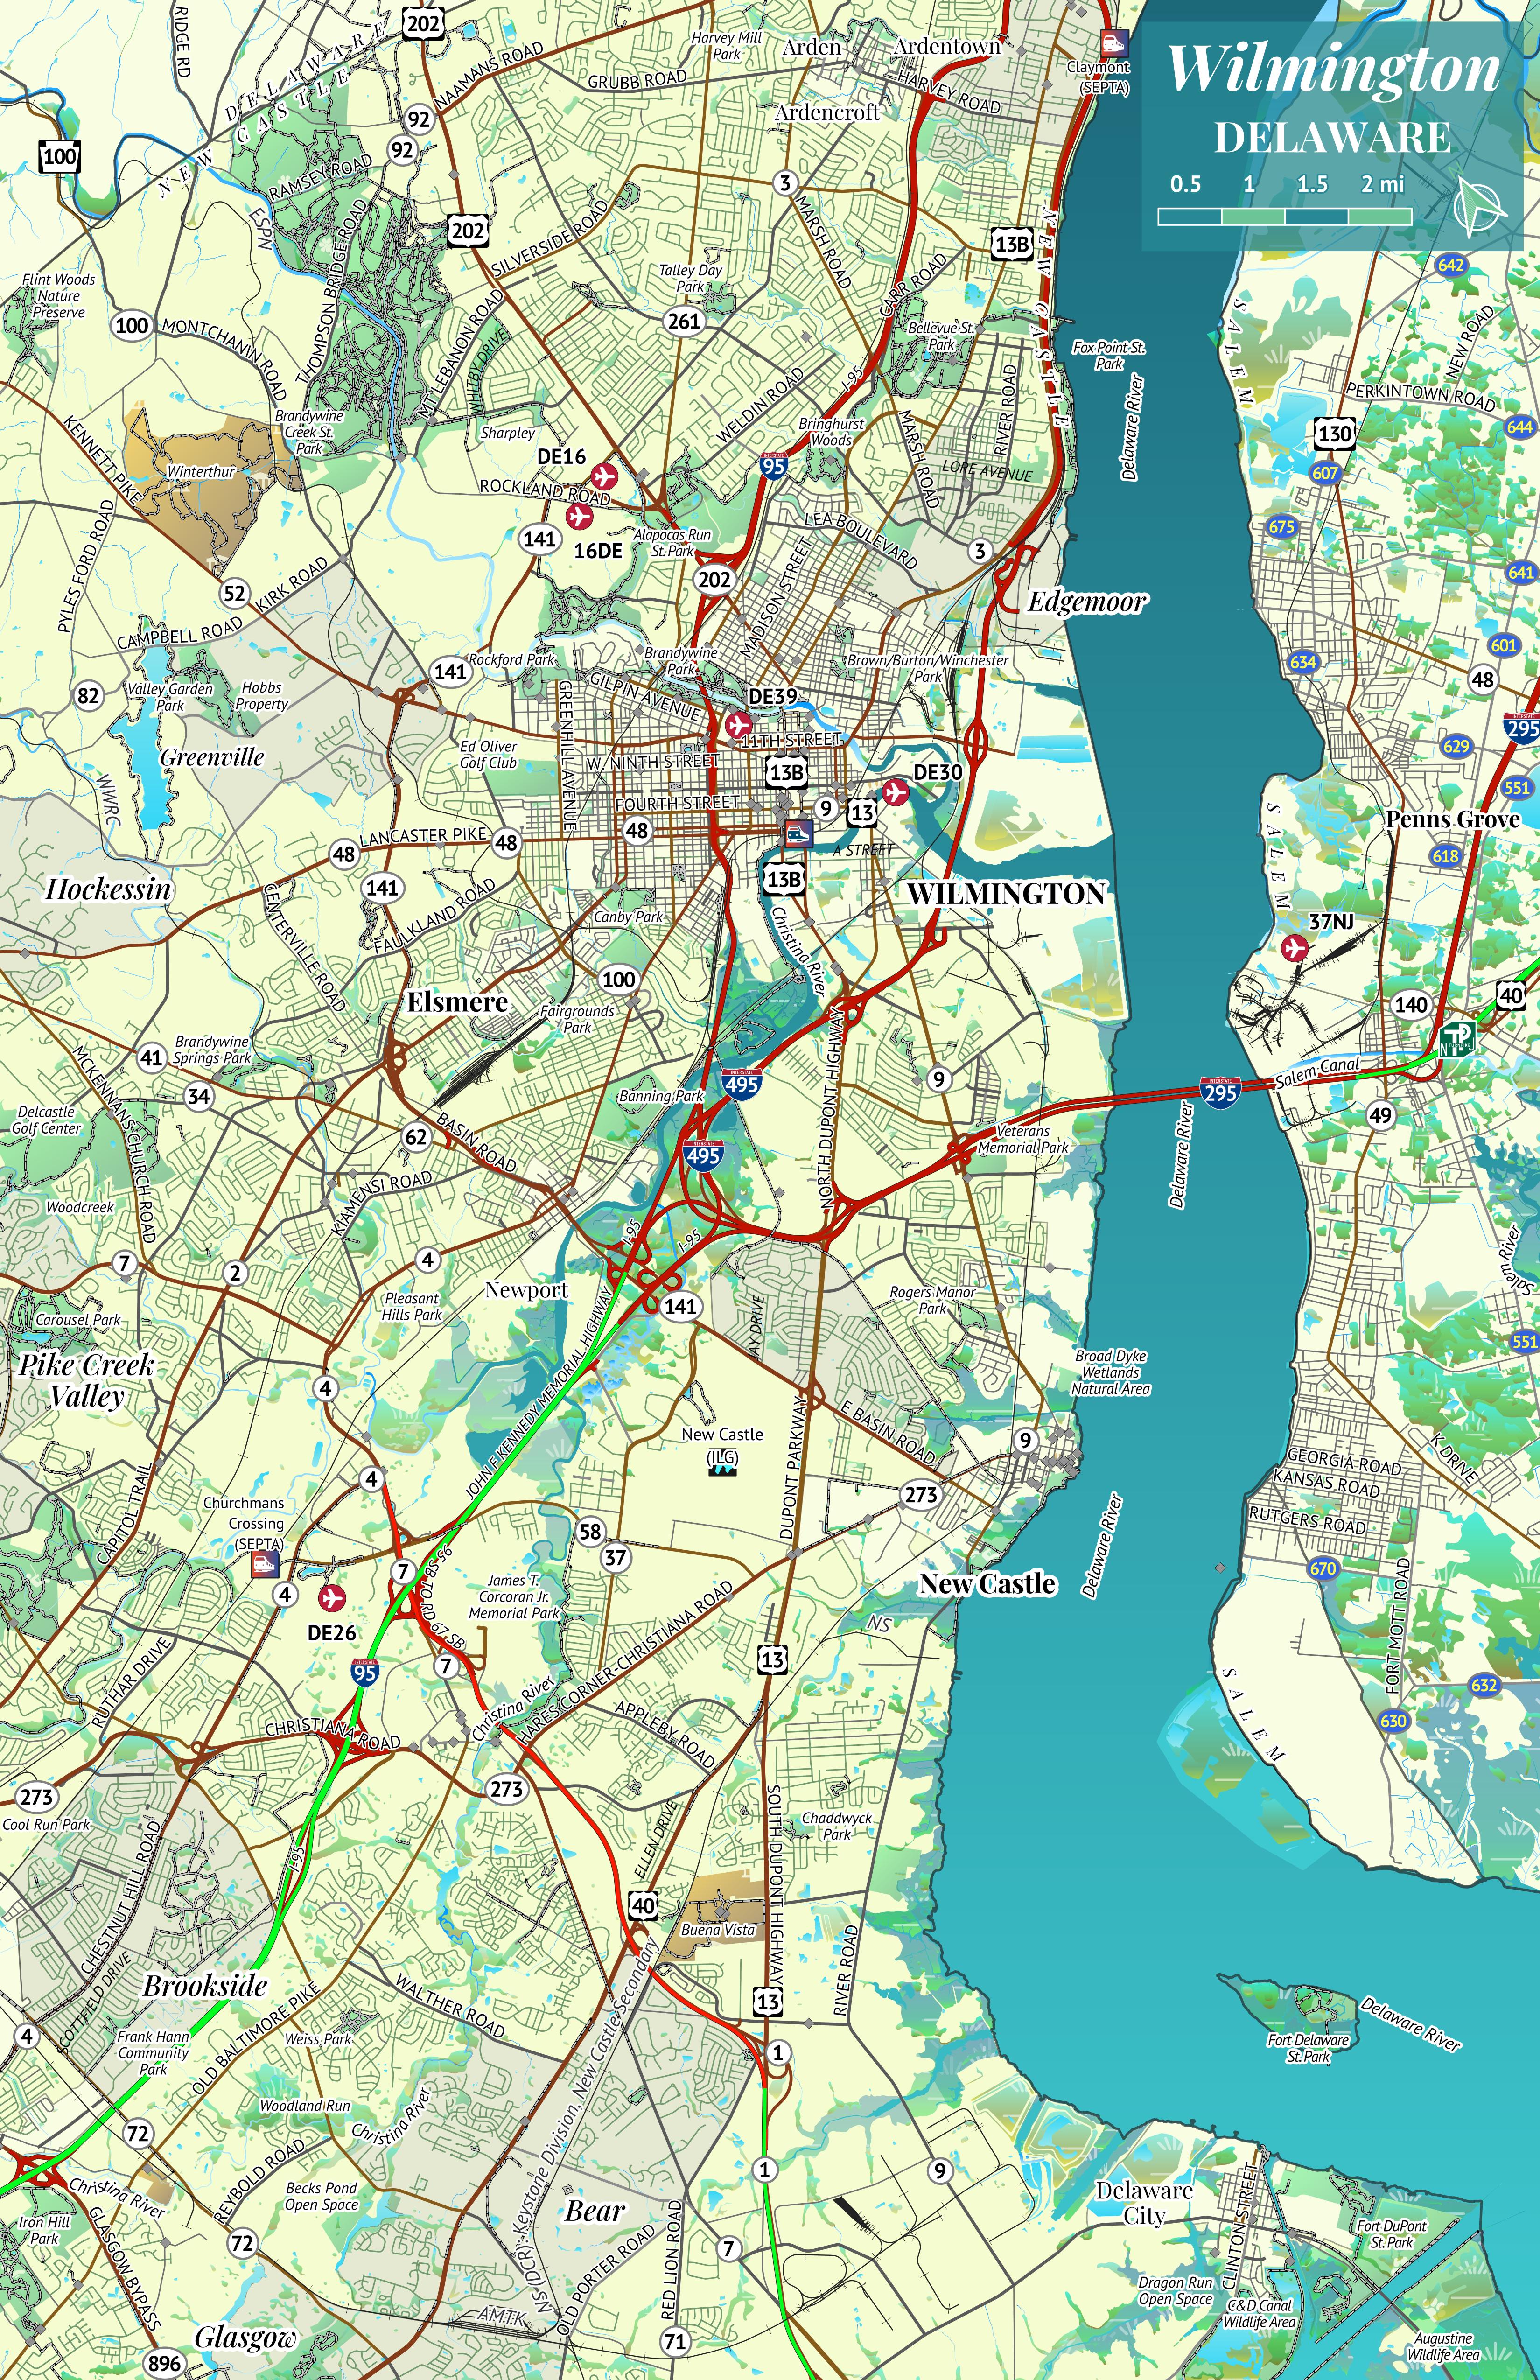
representation between states. For example, the US-13 Business
routes in Delaware are represented as "13B" (see Bridgeville), but
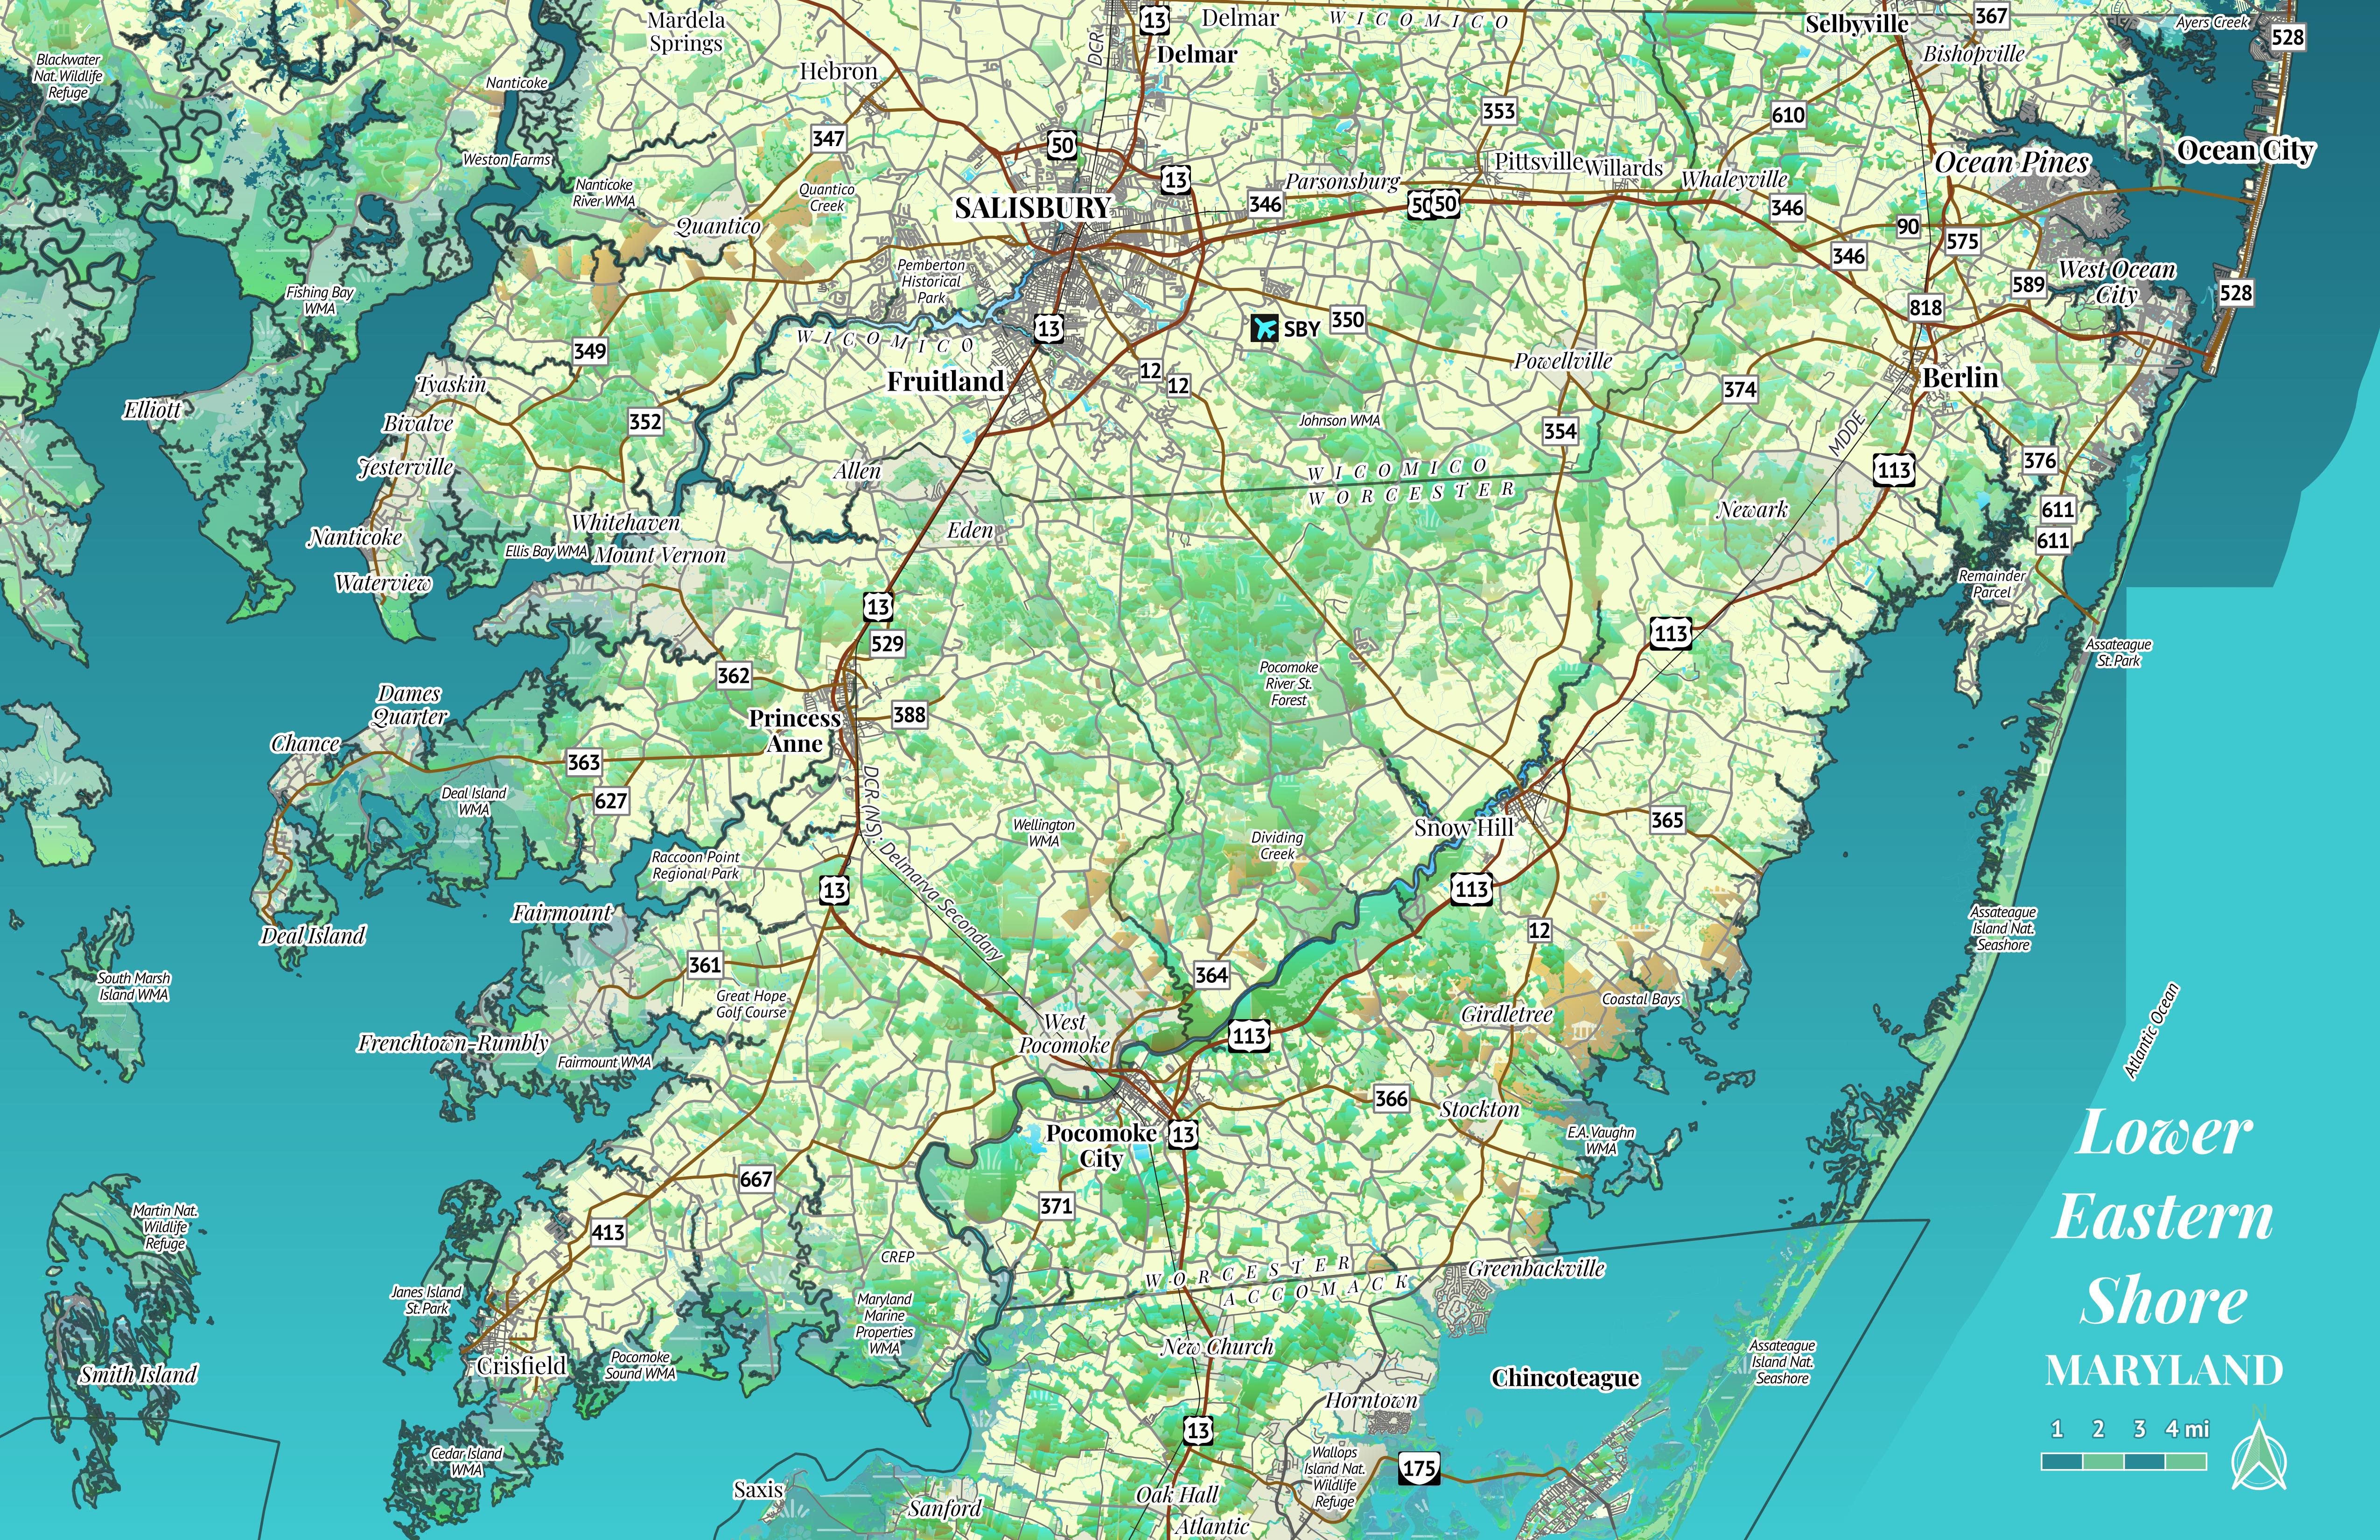
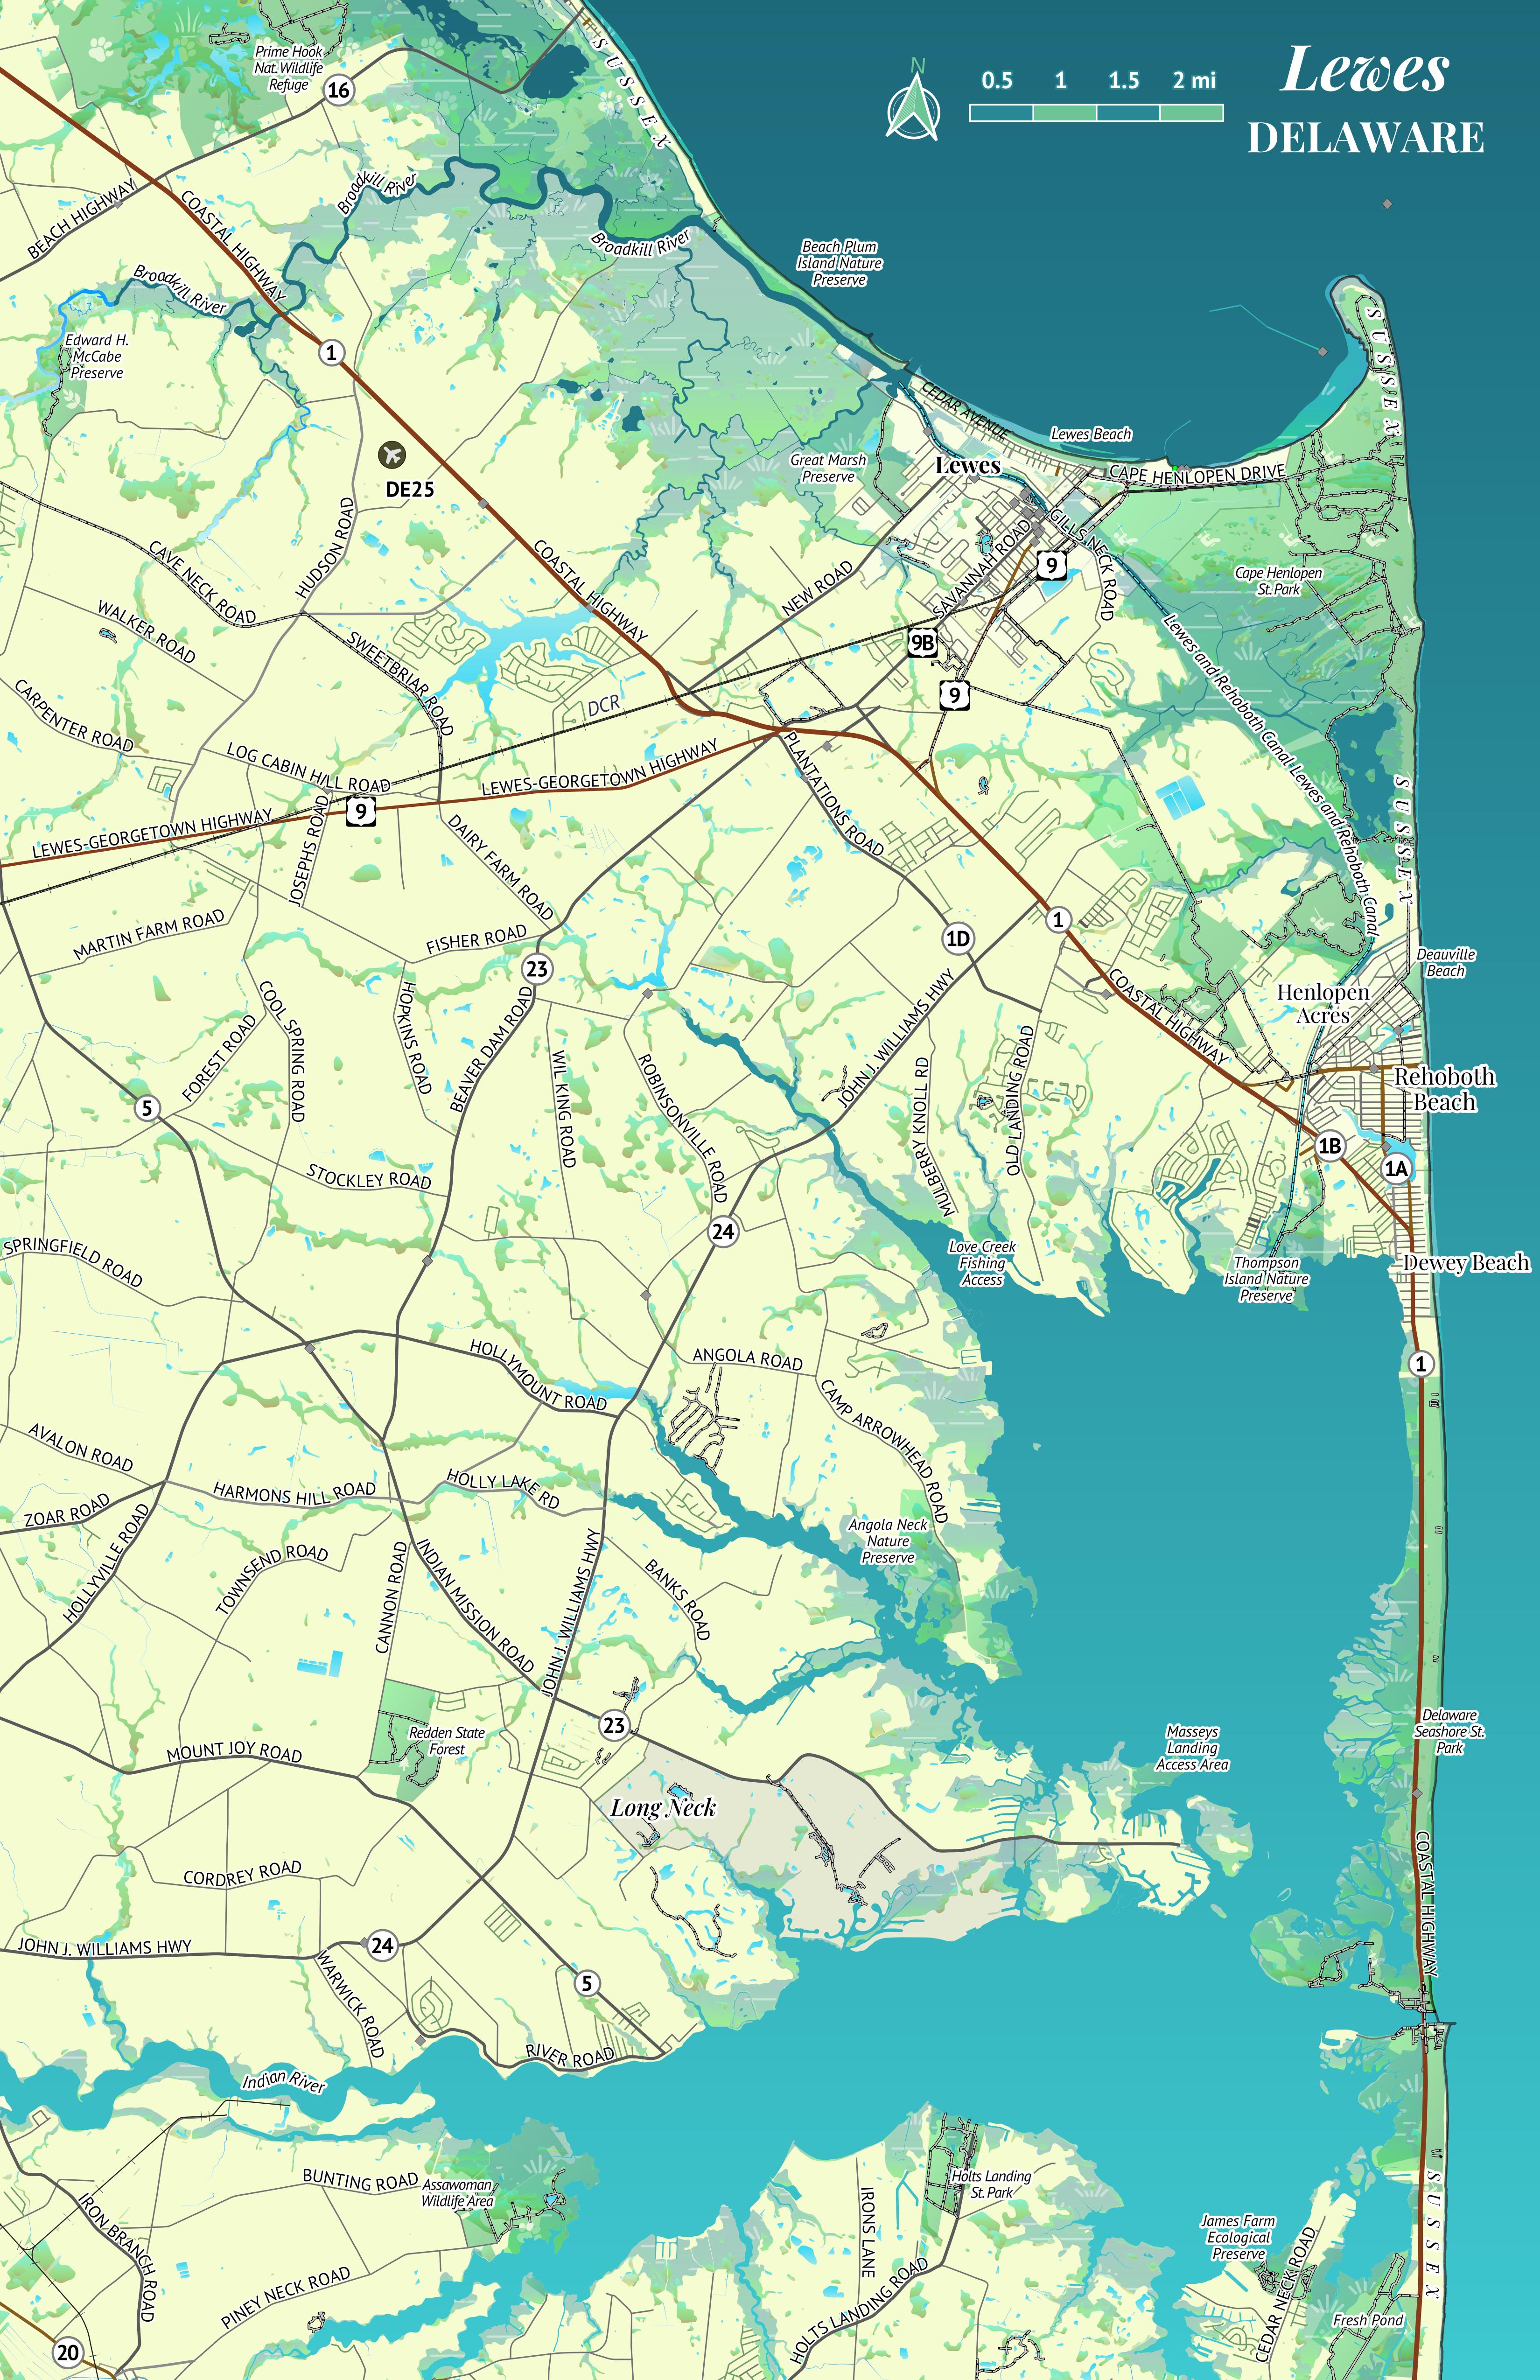
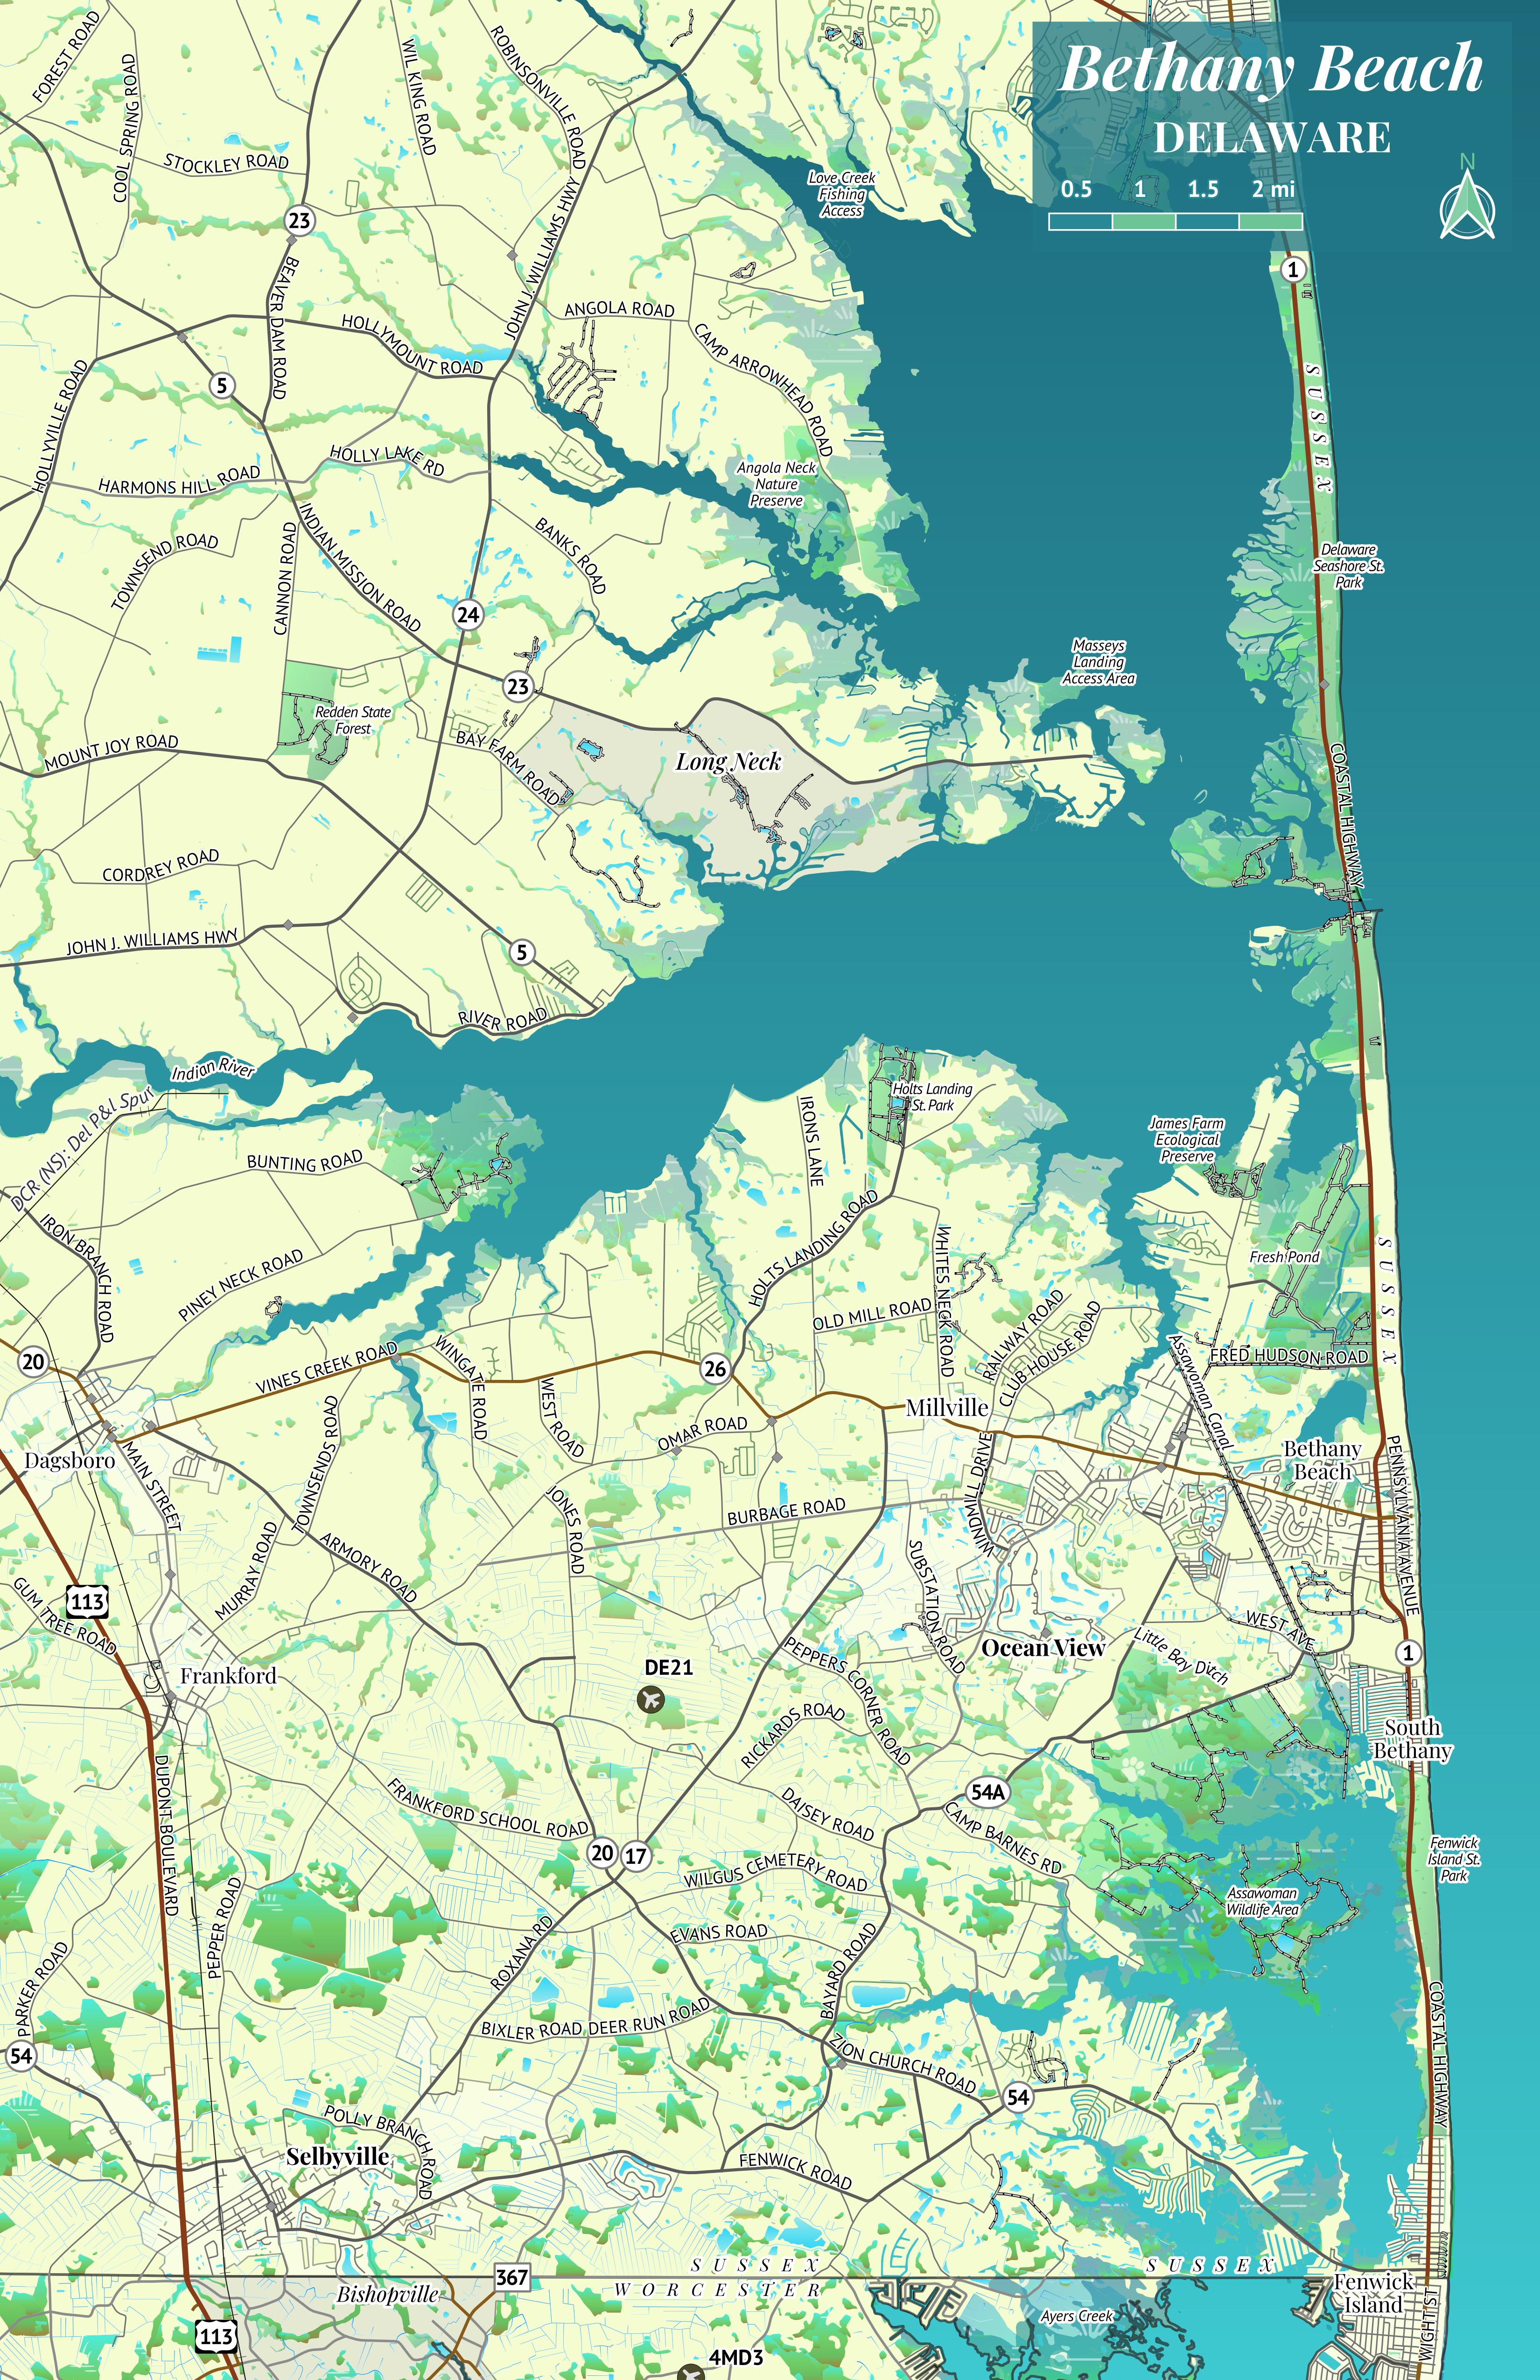
in Maryland they are simply "13" (see Salisbury). Also note the
sharp difference in color used to represent the ocean in any area
with Atlantic coastline. As the National Wetlands Inventory data
was downloaded by state, it cuts off fairly close to each state's
eastern land boundary.
Technology Used
All maps were developed using QGIS 3.24, running on Fedora 36. Three
computers were used to develop the maps, listed below:
- Primary System, Lenovo ThinkCentre M79 (desktop, 2015) -
AMD A8-6500B CPU (quad-core, 3.5-4.1 GHz), 16 GB DDR3-1600
Memory, 240 GB Kingston A400 SSD
- Secondary/Mobile System, Asus VivoBook 15 F512DA (laptop,
2020) - AMD Ryzen 3 3200U CPU (dual-core, 2.6-3.5 GHz),
12 GB DDR4-2400 Memory, 240 GB Kingston A400 SSD
- Testing System, Dell Latitude E5430 (laptop, 2013) -
Intel Core i3-3120M CPU (dual core, 2.5 GHz), 12 GB DDR3-1600
Memory, 120 GB SanDisk SSD Plus
The Maps
All maps were rendered in JPEG format, to reduce file size. The
maps are rendered in a high resolution, with large-scale maps at
6600x10200 resolution (approximately 12 MB each). County and local
maps are rendered at 3300x5100 resolution (approximately 2-3 MB
each). Each map is listed below, in
Delaware-to-Maryland-to-Virginia, north-to-south order.
- Delmarva-wide Maps (~12 MB each)
- Delaware and Maryland County Maps (~3 MB each)
- New Castle
County, Delaware
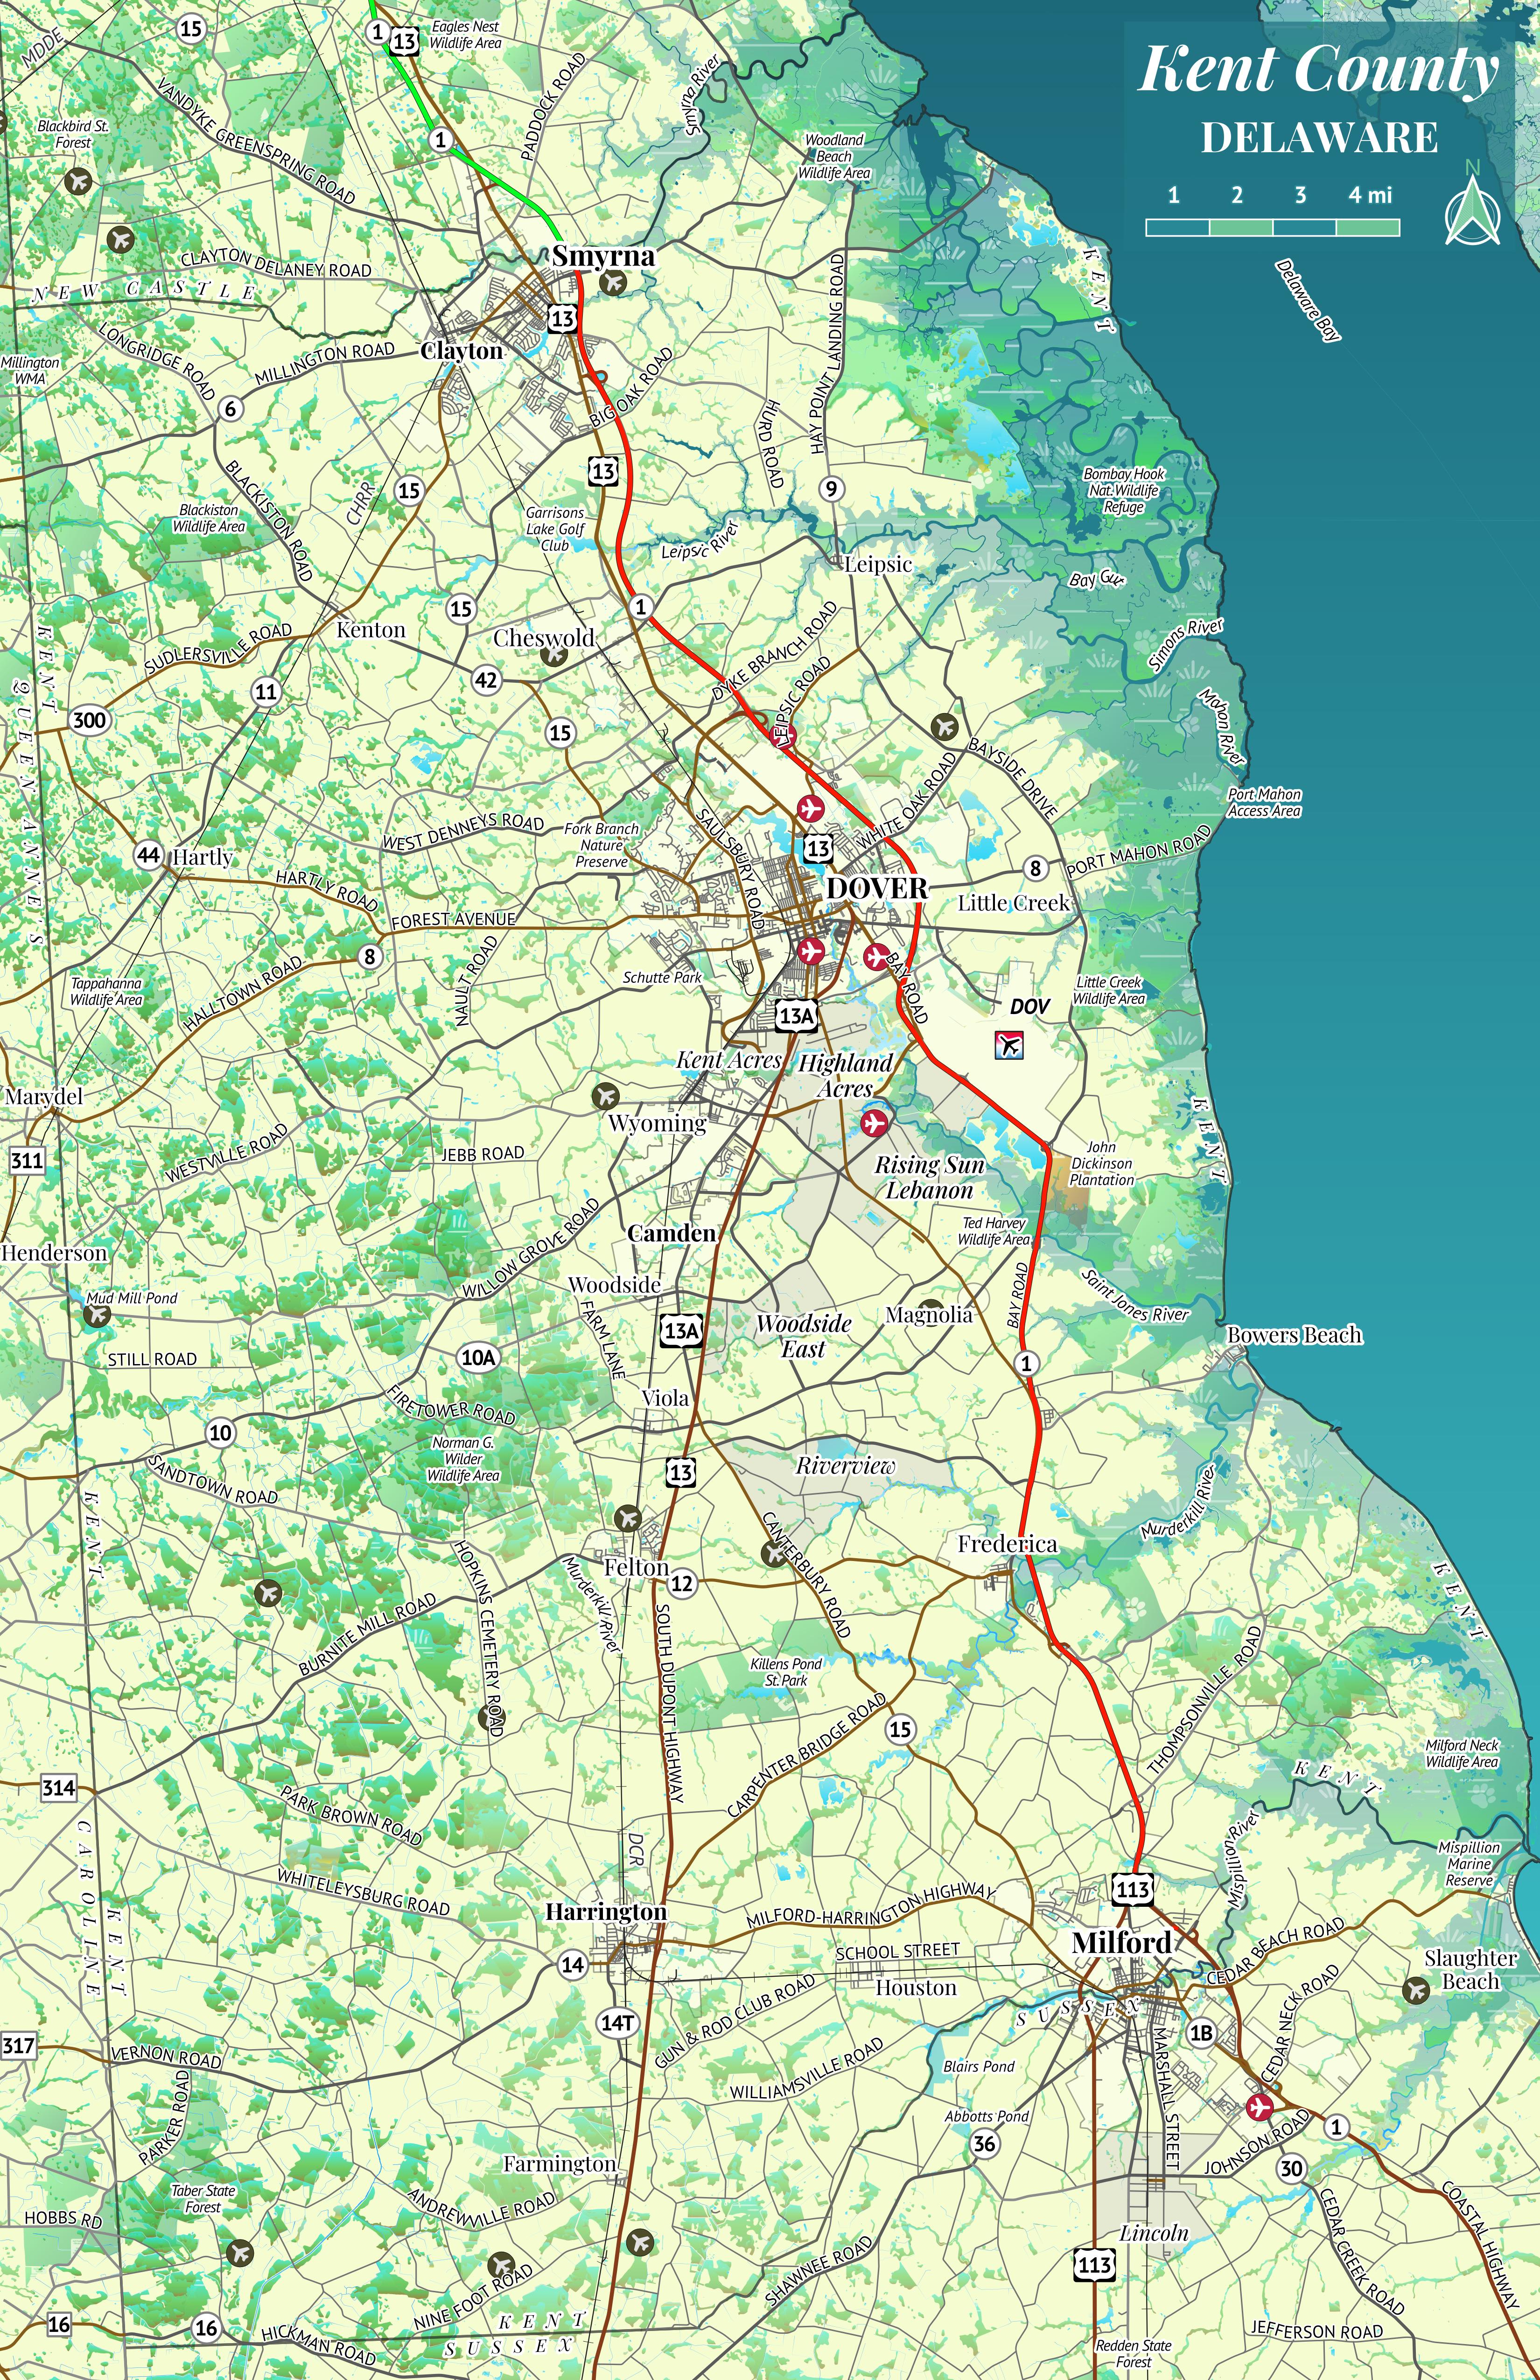
- Kent County, Delaware
- Sussex County,
Delaware
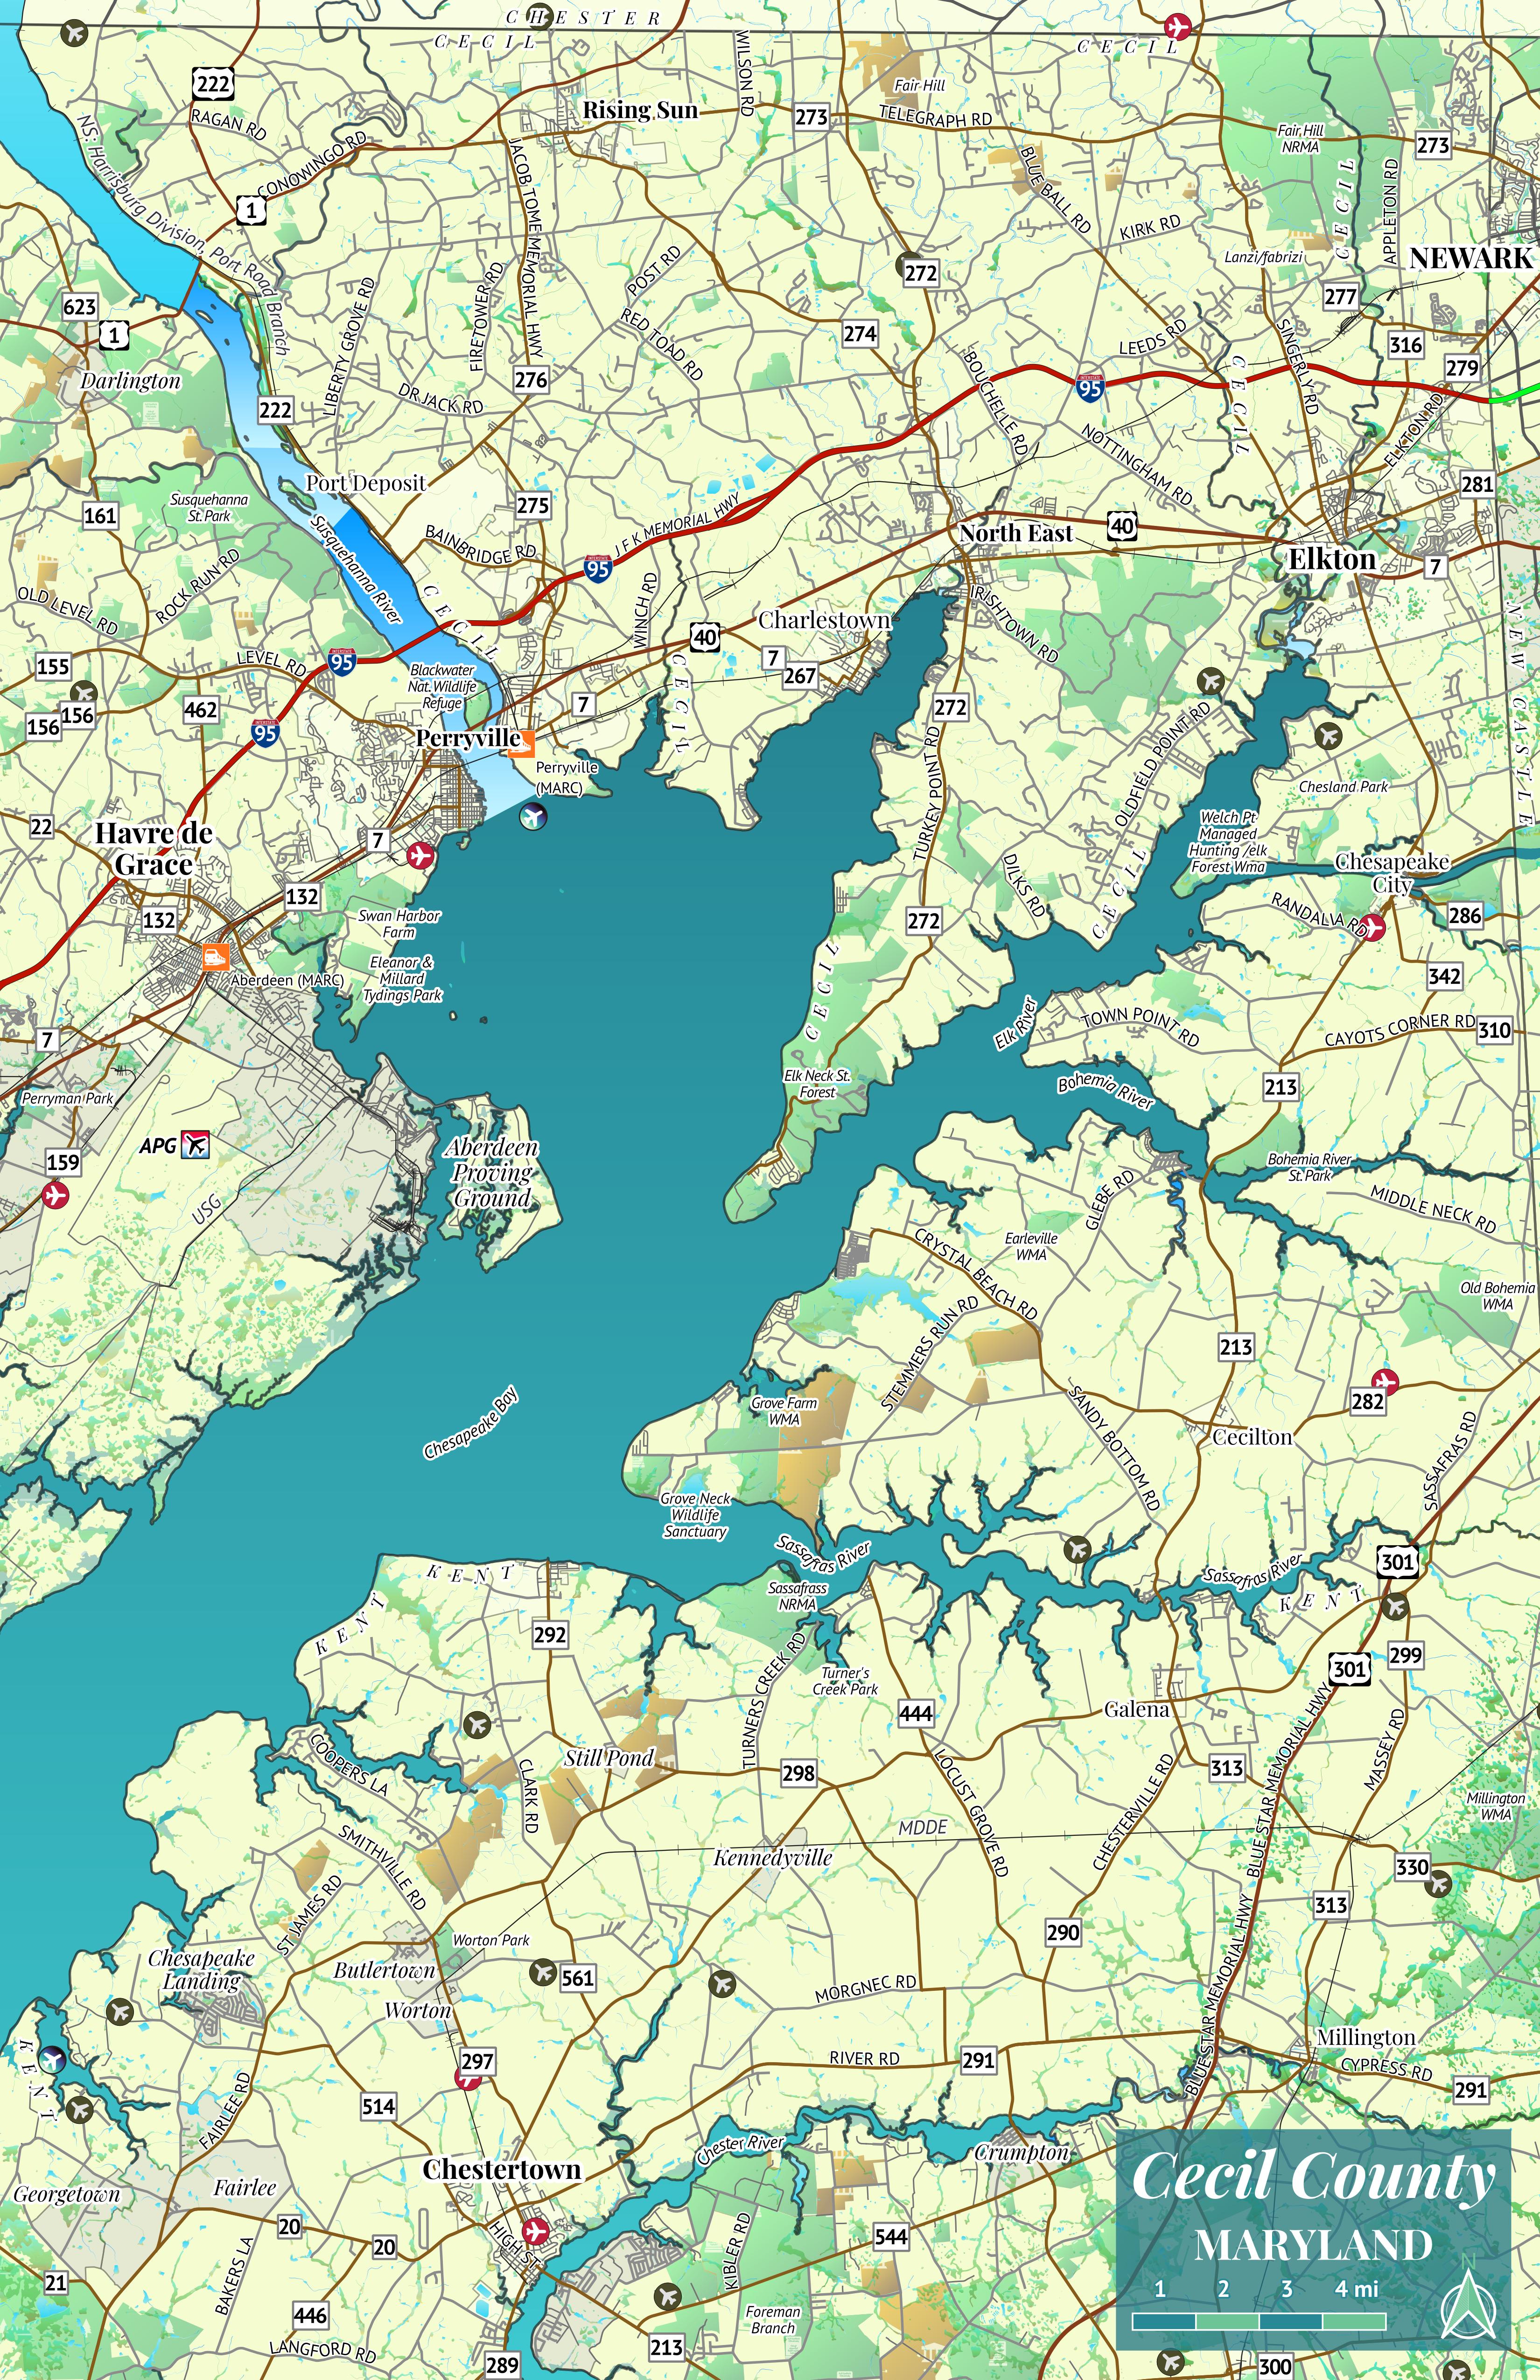
- Cecil County,
Maryland
- Kent County, Maryland
- Queen Anne's County,
Maryland
- Caroline County,
Maryland
- Talbot County,
Maryland
- Dorchester
County, Maryland
- Somerset, Worcester,
and Wicomico, Maryland
- Delaware Local Maps (~2 MB each)
- Maryland/Virginia Local Maps (~2 MB each)