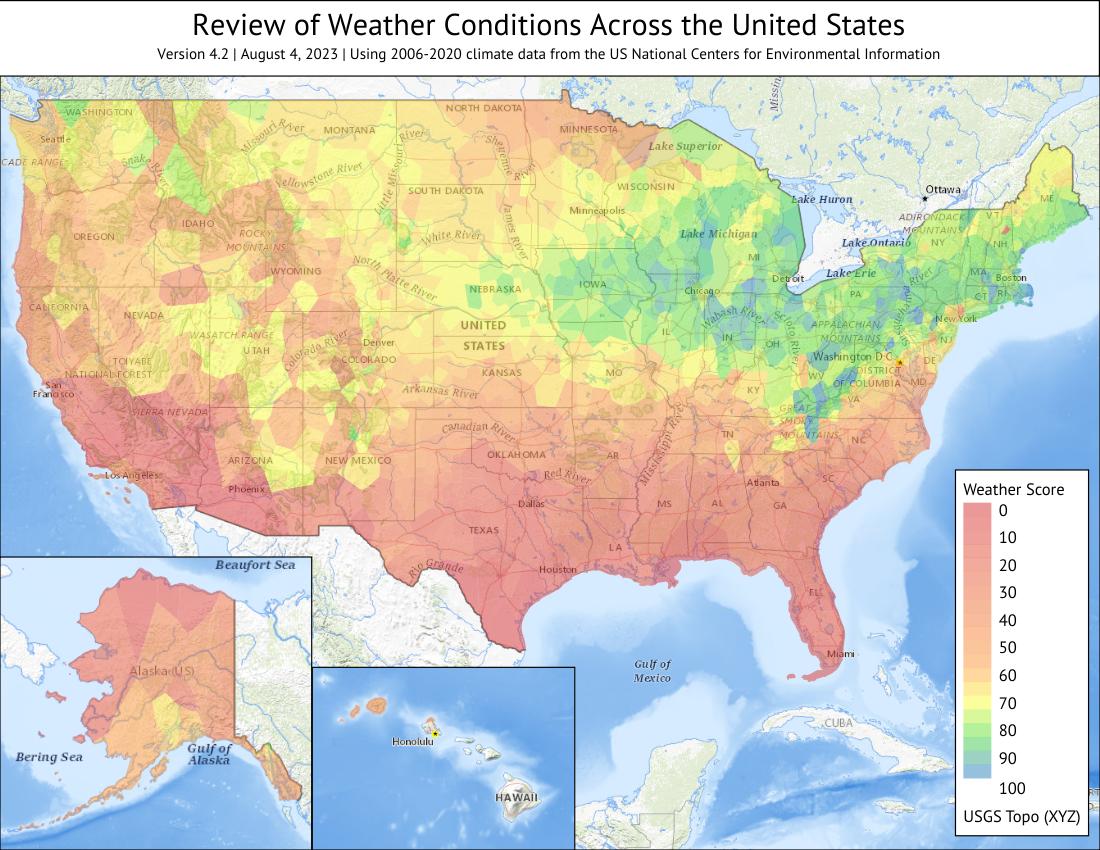
Being the person I am, I decided to download historical weather data for the entire United States to see if I could get an idea of where I should live, based on weather conditions. The dataset, U.S. Climate Normals 2020: U.S. Monthly Climate Normals (2006-2020), was downloaded from the National Centers for Environmental Information, a section of NOAA. This provided data for 13,363 weather stations across the United States, which consolidated to 1,368 stations with data on temperature, precipitation, and snowfall.
I used the following parameters, based on my ideal conditions.
| Max Not OK (0%) |
Lowest OK (90%) |
Ideal (100%) |
Highest OK (90%) |
Min Not OK (0%) |
|
| High Temp July |
N/A |
70°F |
75°F | 80°F | 90°F |
| Low Temp July |
N/A |
55°F | 60°F | 65°F | 75°F |
| High Temp January |
N/A |
30°F | 35°F | 40°F | 55°F |
| Low Temp January |
N/A |
10°F | 15°F | 25°F | 40°F |
| Snowfall January |
0.25" |
5.00" |
7.50" |
15.0" |
20.0" |
| Snowfall Year-Round |
3" |
20" |
30" |
45" |
60" |
| Precipitation Year-Round |
25" |
40" |
50" |
60" |
75" |
| Statistic (x) |
Model |
Weight |
| High Temp: July |
Score = -0.0045x² + 0.6679x -
24.029 |
18.75% |
| Low Temp: July |
Score = -0.0045x² + 0.5343x -
15.013 |
18.75% |
| High Temp: January |
Score = -0.0025x² + 0.1739x -
2.0801 |
18.75% |
| Low Temp: January |
Score = -0.002x² + 0.07x + 0.4 |
18.75% |
| Snowfall: January |
Score = -0.0115x² + 0.2319x -
0.0395 |
8.33% |
| Snowfall: Year-Round |
Score = -0.0013x² + 0.0825x -
0.2419 |
8.33% |
| Precipitation: Year-Round |
Score = -0.0017x² + 0.166x -
3.1083 |
8.33% |
The map below shows the results of my analysis, clicking it will
show a higher resolution version and labels for several
locations. The map shows Voronoi polygons, which shows the
areas where the weather station in question is the closest, for
each weather station. These polygons are clipped to the
boundaries of the 50 states, though part of Hawaii is not shown.
The tables below show my top and bottom 20 locations, based on these scores.
| Weather Station |
Region |
Score |
| Beckley VA Hospital, WV |
Beckley, WV |
100.0% |
| Mustoe, VA |
Staunton, VA |
99.7% |
| Burkes Garden, VA |
Wytheville, VA |
99.6% |
| Garrett, IN |
Fort Wayne, IN |
97.7% |
| Kennebunkport, ME |
Portland, ME |
97.6% |
| Bluefield, WV |
Wytheville, VA |
97.6% |
| Frost, WV |
Staunton, VA |
97.4% |
| South Mountain, PA |
Hagerstown, MD |
97.2% |
| Stevenson Dam, PA |
State College, PA |
96.4% |
| Chatham, MA |
Cape Cod, MA |
96.3% |
| Bluefield, WV |
Wytheville, VA |
96.0% |
| Canton, PA |
Mansfield, PA |
95.9% |
| Mahanoy City, PA |
Hazleton, PA |
95.8% |
| West Thompson Lake, CT |
Willimantic, CT |
95.6% |
| Mill Gap, VA |
Staunton, VA |
95.5% |
| Buckeye, WV |
Staunton, VA |
95.4% |
| Flat Springs, NC |
Bristol, VA |
95.1% |
| Coldwater Street School, MI |
Kalamazoo, MI |
95.1% |
| Angola, IN |
Fort Wayne, IN |
94.9% |
| Middleton, MA |
Boston, MA |
94.8% |
Generally speaking, the absolute least desirable areas for me to live are primarily in the inland southwestern United States. Mount Washington, New Hampshire seems to be the sole outlier here, but I believe that's because the weather station on Mount Washington is at the top of the mountain. Mount Washington tends to get extraordinarily cold and receives unbelievably large amounts of snow. As much as I love the winter, that's a bit much for me.
| Weather Station |
Region |
Score |
| Lake Havasu City, AZ |
Lake Havasu, AZ |
0.0% |
| Laughlin, NV |
Lake Havasu, AZ |
0.0% |
| Las Vegas McCarran Airport, NV |
Las Vegas, NV |
0.0% |
| Death Valley National Park, CA |
Death Valley, CA |
0.0% |
| Del Rio International Airport,
TX |
Del Rio, TX |
0.0% |
| Tucson International Airport,
AZ |
Tucson, AZ |
0.0% |
| Hayfield Pumping Plant, CA |
El Centro, CA |
1.2% |
| Bakersfield Airport, CA |
Bakersfield, CA |
1.9% |
| Tempe Arizona State
University, AZ |
Phoenix, AZ |
2.4% |
| Corpus Christi NWS Office, TX |
Corpus Christi, TX |
2.9% |
| Kingsville, TX |
Laredo, TX |
3.1% |
| Corpus Christi, TX |
Corpus Christi, TX |
3.3% |
| San Antonio International
Airport, TX |
San Antonio, TX |
3.8% |
| Las Vegas Weather Forecast
Office, NV |
Las Vegas, NV |
4.0% |
| Mobile, AL |
Mobile, AL |
4.2% |
| Cuero, TX |
San Antonio, TX |
4.3% |
| Corpus Christi Botanical
Gardens, TX |
Corpus Christi, TX |
4.7% |
| Port Arkansas, TX |
Corpus Christi, TX |
5.0% |
| Mount Washington, NH |
Saint Johnsbury, VT |
5.8% |
| Austin Camp Marby, TX |
Austin, TX |
6.0% |